Correction (July 21, 2026): The original article described its charter_status == "No" filter as excluding only independent-study and online charter schools. California defines that selection as all non-charter schools; the correction uses that scope throughout and directly reports the separate all-status and charter-only rates. It also replaces an unrelated source link, removes explanations the attendance file cannot test, and adds the 2023-24 result now available through the data package. The previously published county, district and large-county values reproduce.
Sacramento County's non-charter schools reported 216,203 eligible students in 2024-25. Of those, 47,356 were chronically absent, a rate of 21.9%.
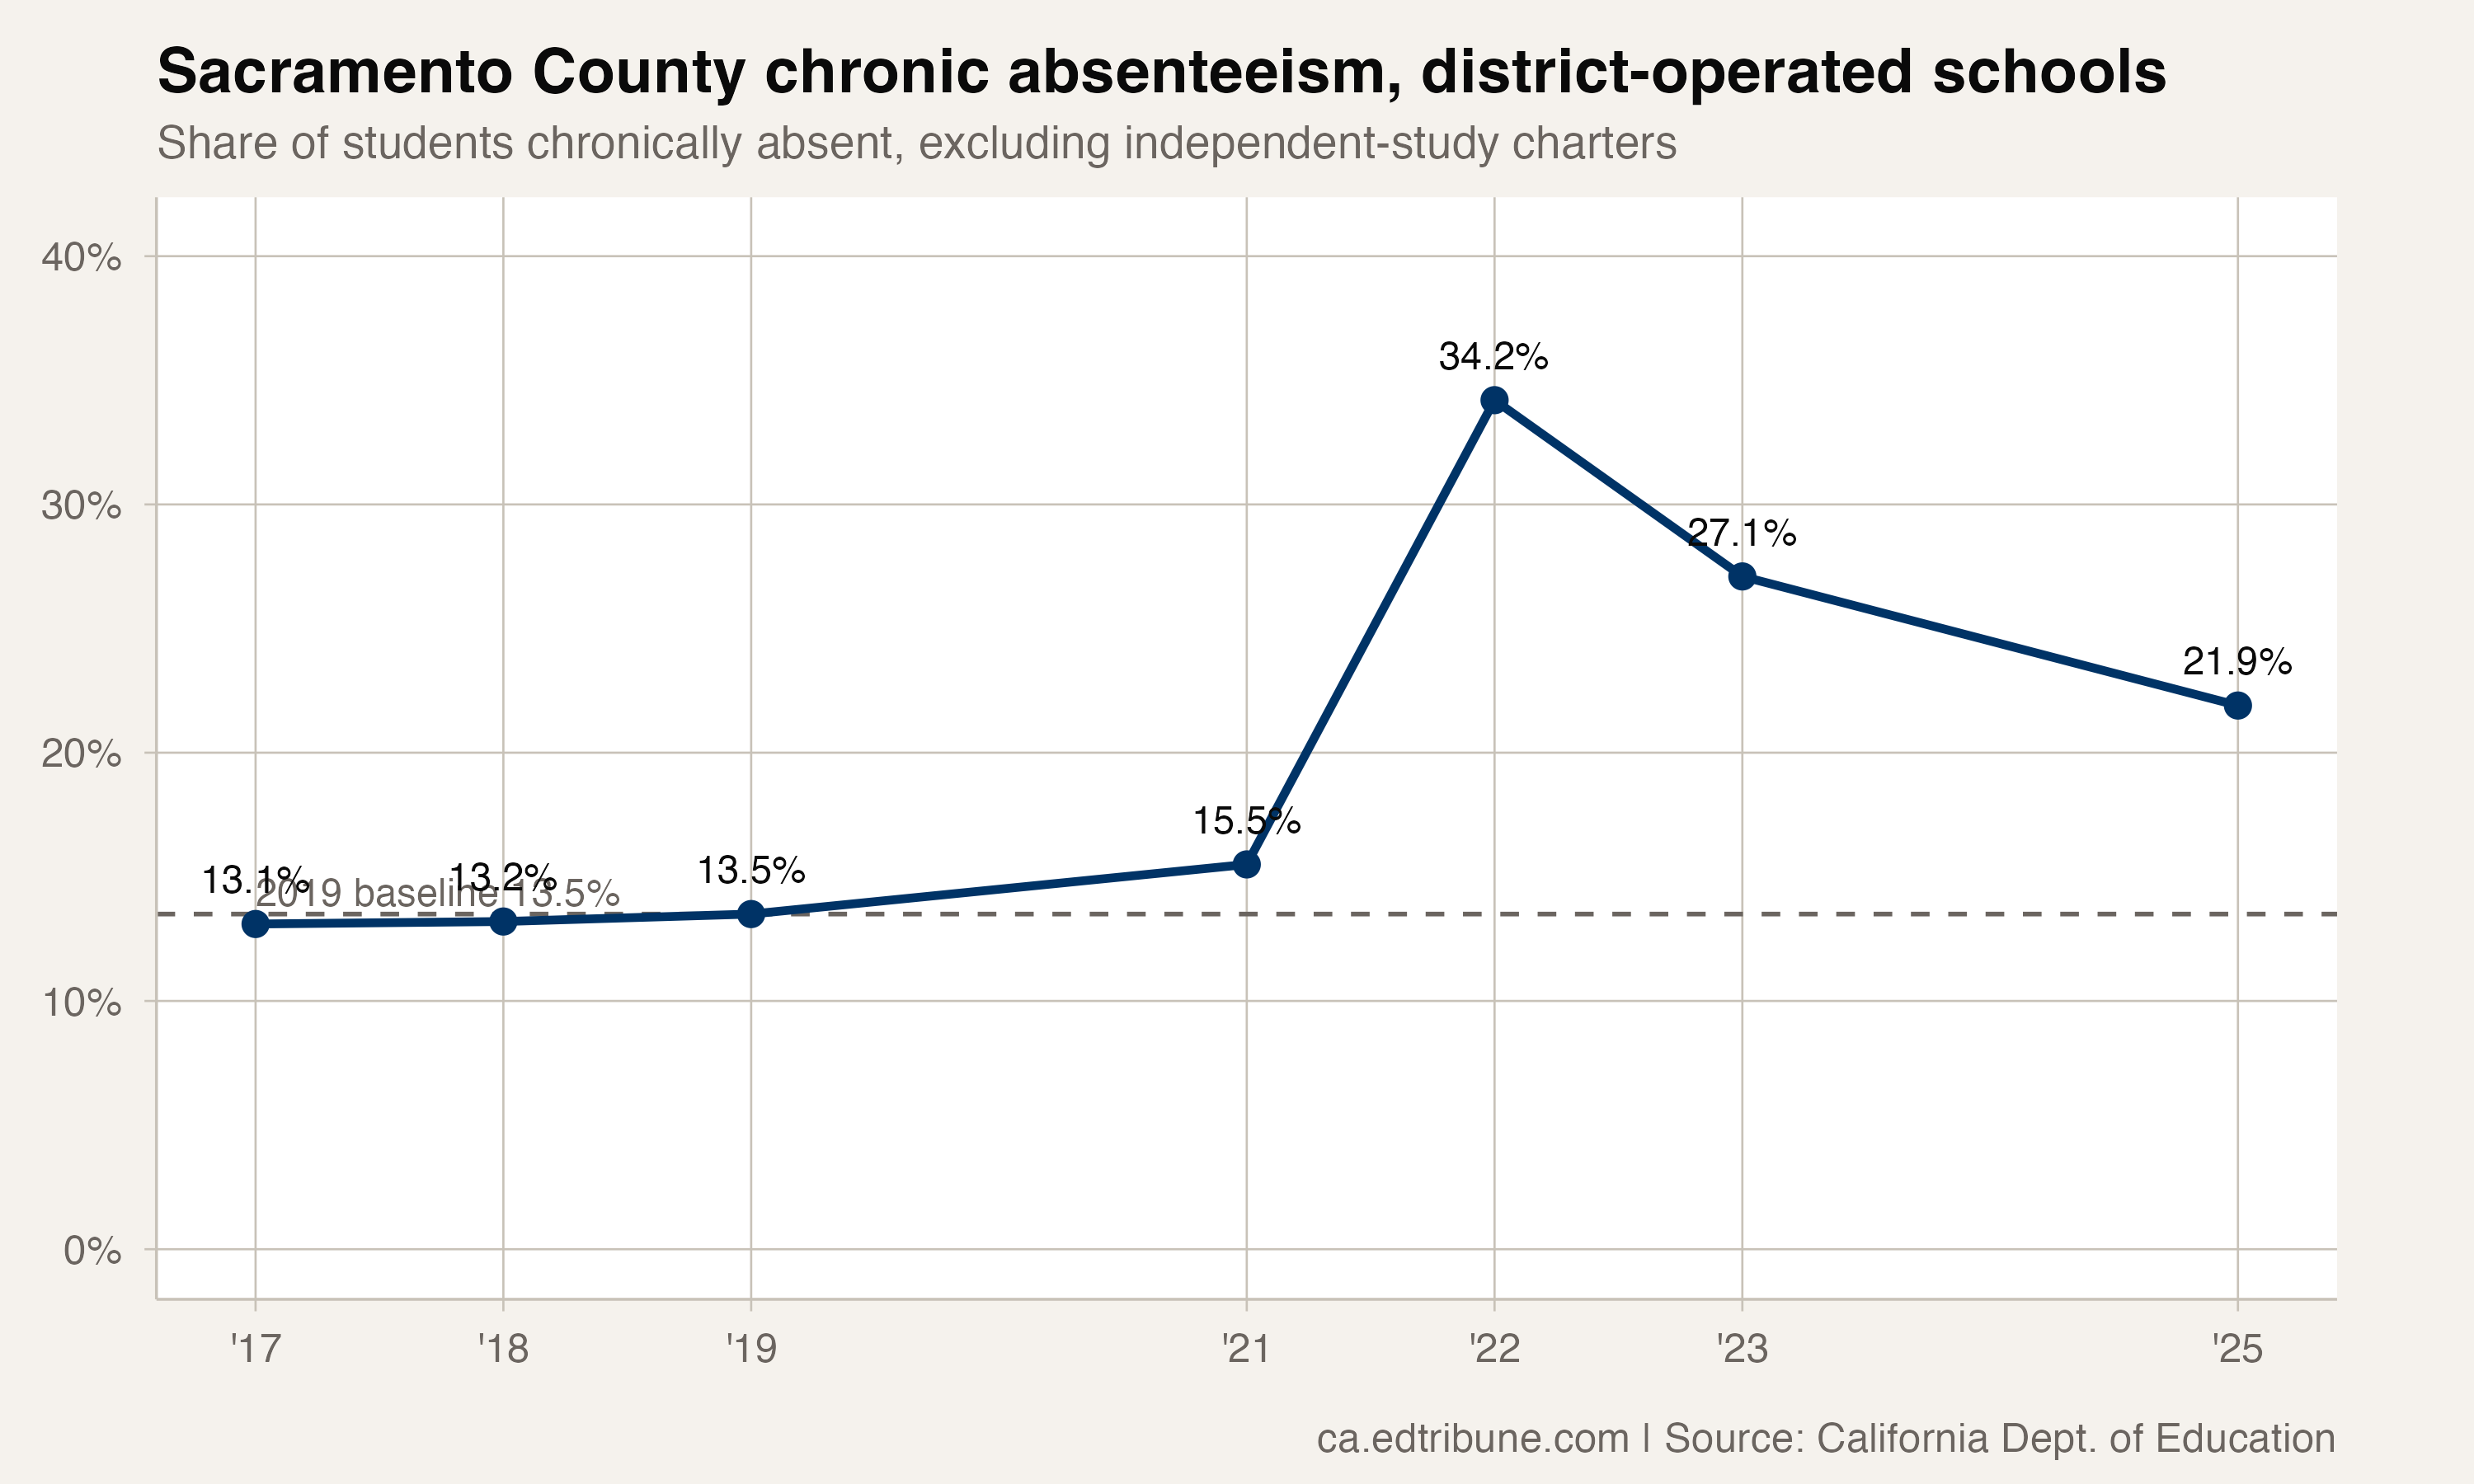
That was 2.4 points above the statewide non-charter rate of 19.5% and 8.4 points above Sacramento County's 13.5% rate in 2018-19.
Three Consecutive Post-Peak Declines
Sacramento County's non-charter rate reached 34.2% in 2021-22. It then fell to 27.1% in 2022-23, 23.3% in 2023-24 and 21.9% in 2024-25. The latest rate was 12.3 points below the peak but remained 8.4 points above 2018-19.
California did not publish 2019-20 absenteeism data and recommends caution when comparing years because of pandemic-era reporting changes. Those qualifications are documented on the California Department of Education's chronic absenteeism data page.
What the Charter Filter Changes
The main analysis selects charter_status == "No" and dass_status == "All". California's file structure defines that charter selection as all non-charter schools in the aggregate.
For Sacramento County in 2024-25, the row including all charter statuses reported 25.7%, 3.8 points above the 21.9% non-charter row. The charter-only row reported 41.2%. These aggregate rows show why scope matters; they do not establish which school models or attendance policies produced the difference.
Sixth by Increase, Fifth by Current Level
Among 13 California counties with at least 100,000 eligible students in the 2024-25 non-charter row, Sacramento ranked sixth by the increase from 2018-19.
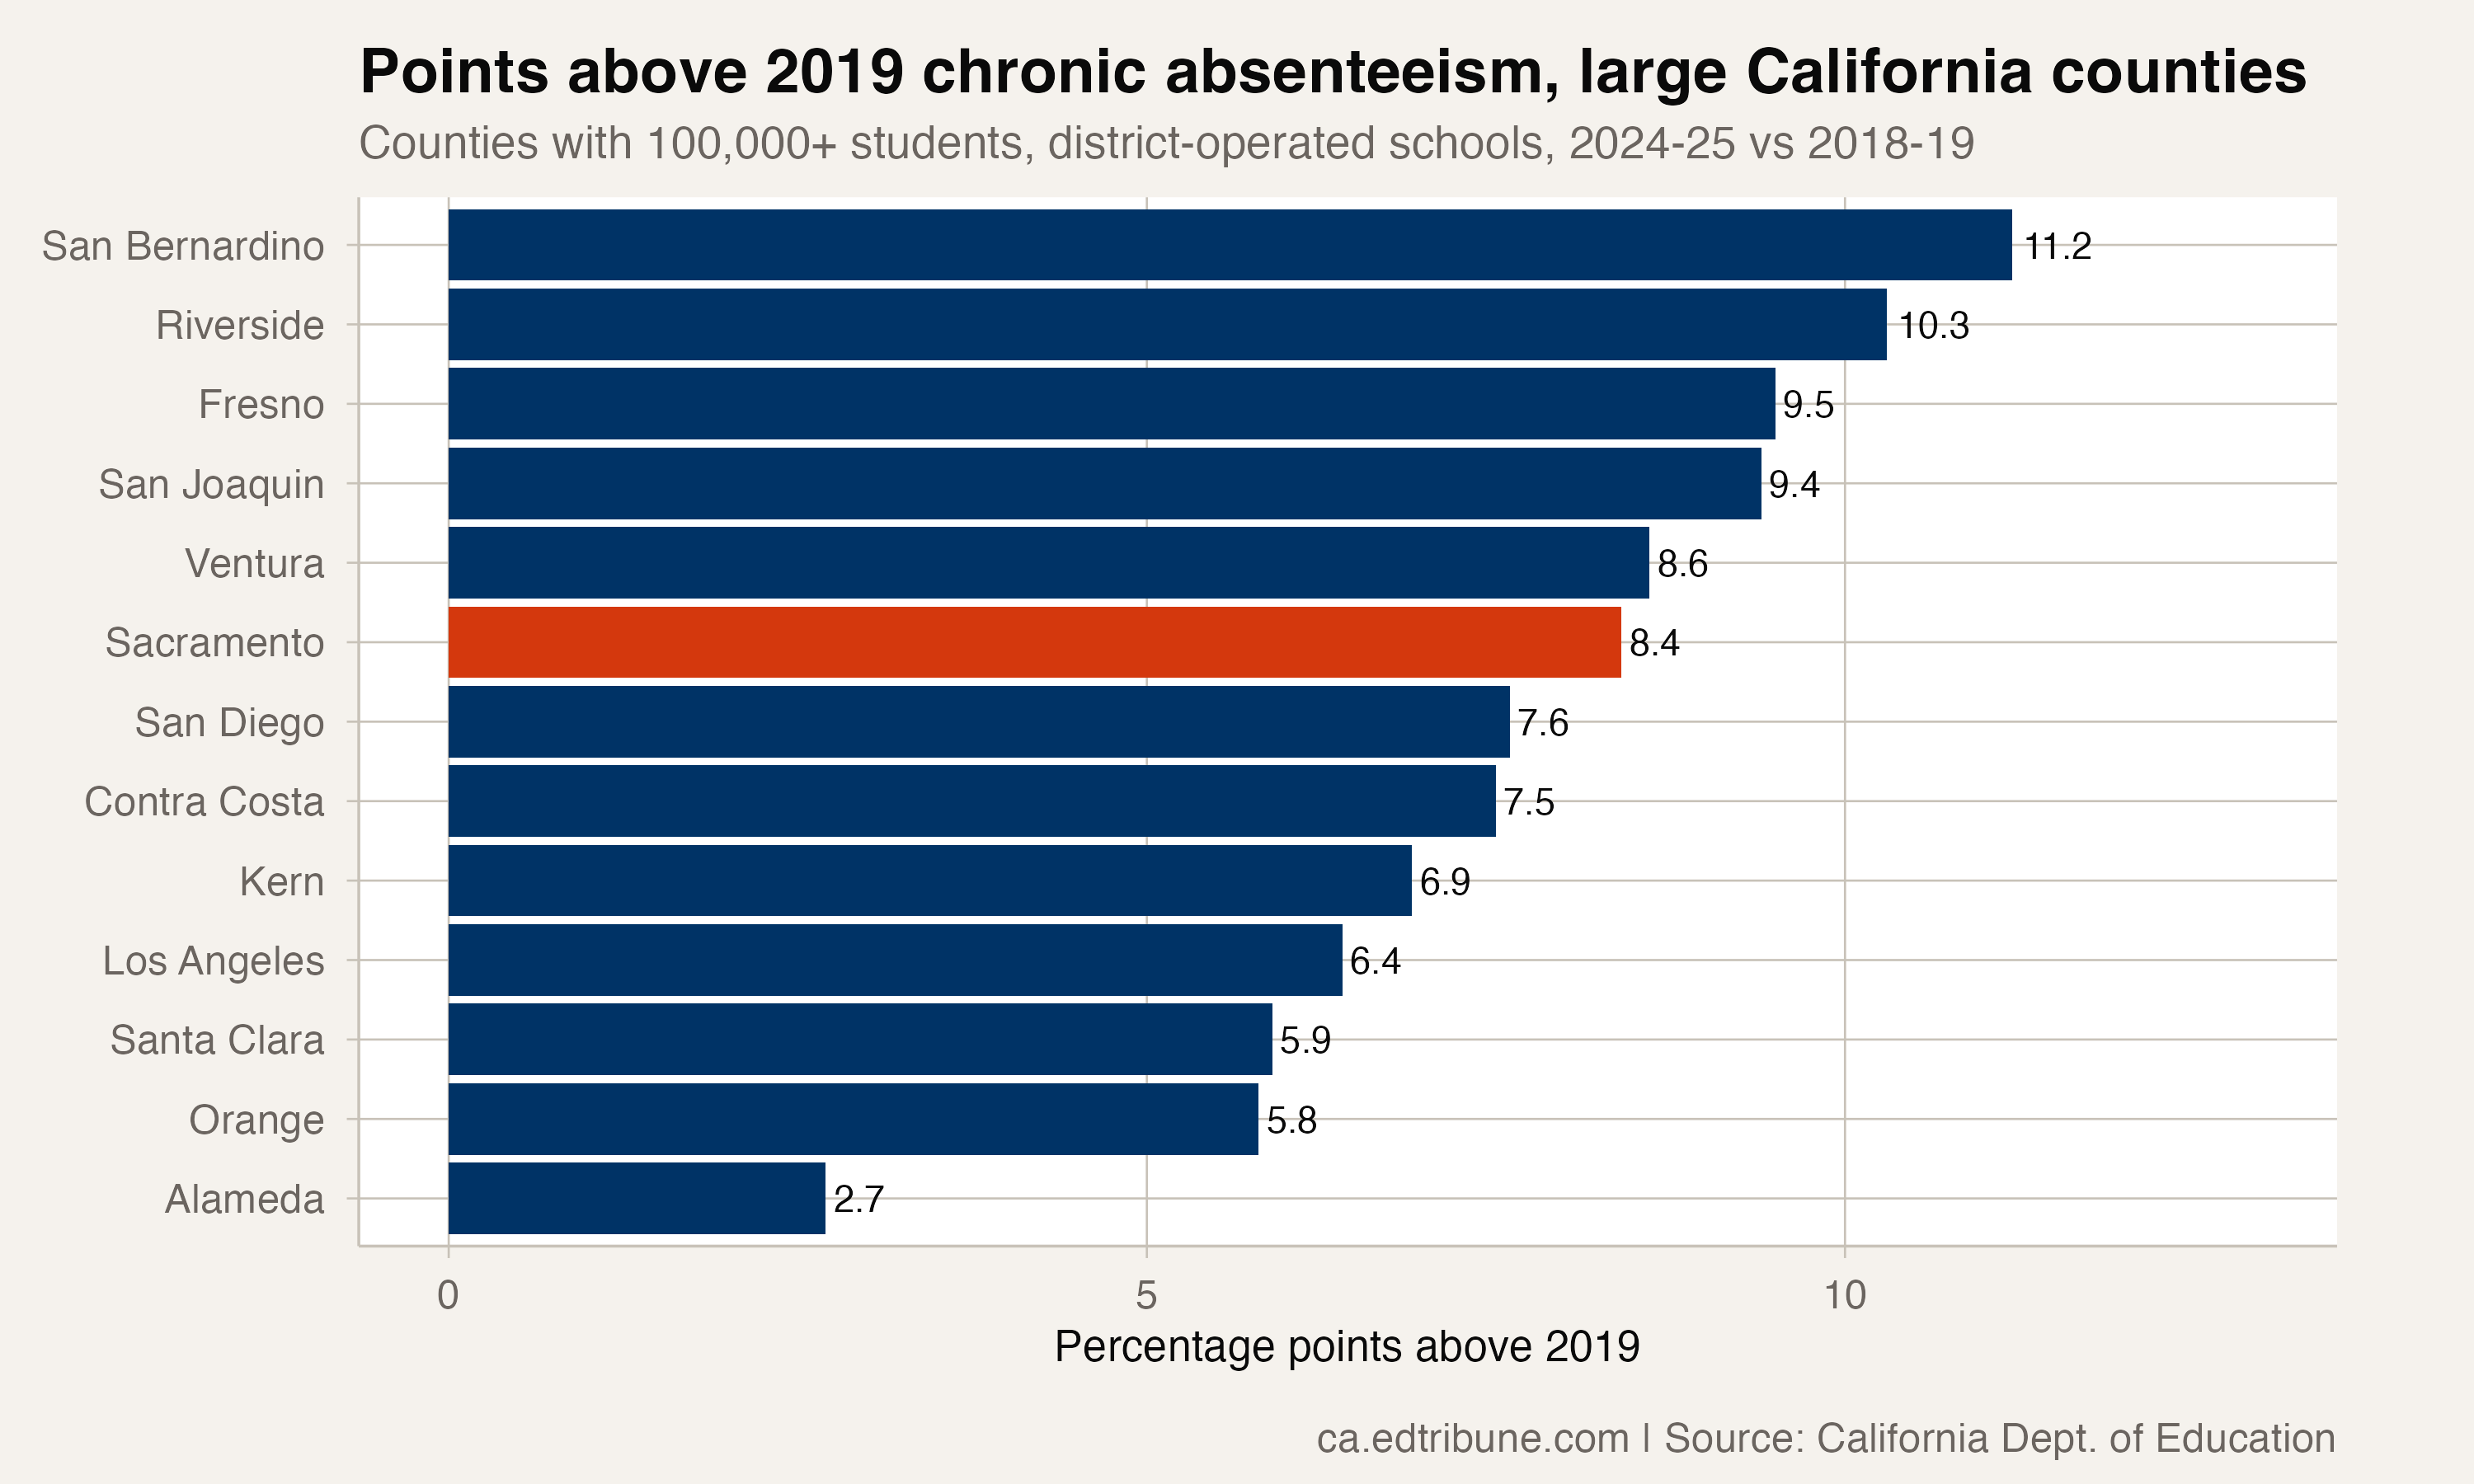
San Bernardino led with an 11.2-point increase, followed by Riverside at 10.3, Fresno at 9.5, San Joaquin at 9.4 and Ventura at 8.6. Sacramento's increase was 8.4 points. San Diego followed at 7.6, Contra Costa at 7.5, Kern at 6.9 and Los Angeles at 6.4.
Measured by the 2024-25 rate rather than the increase, Sacramento ranked fifth. San Bernardino reported 24.5%, San Joaquin 23.6%, Riverside 23.2%, Fresno 22.0% and Sacramento 21.9%.
An 18.3-Point District Spread
Among Sacramento County districts with at least 5,000 eligible students in the non-charter row, Twin Rivers Unified↗ET reported the highest 2024-25 rate at 30.4%. Sacramento City Unified↗ET was at 25.2%, San Juan Unified↗ET at 23.9%, Natomas Unified at 22.2%, Elk Grove Unified↗ET at 19.8% and Folsom-Cordova Unified↗ET at 12.1%.
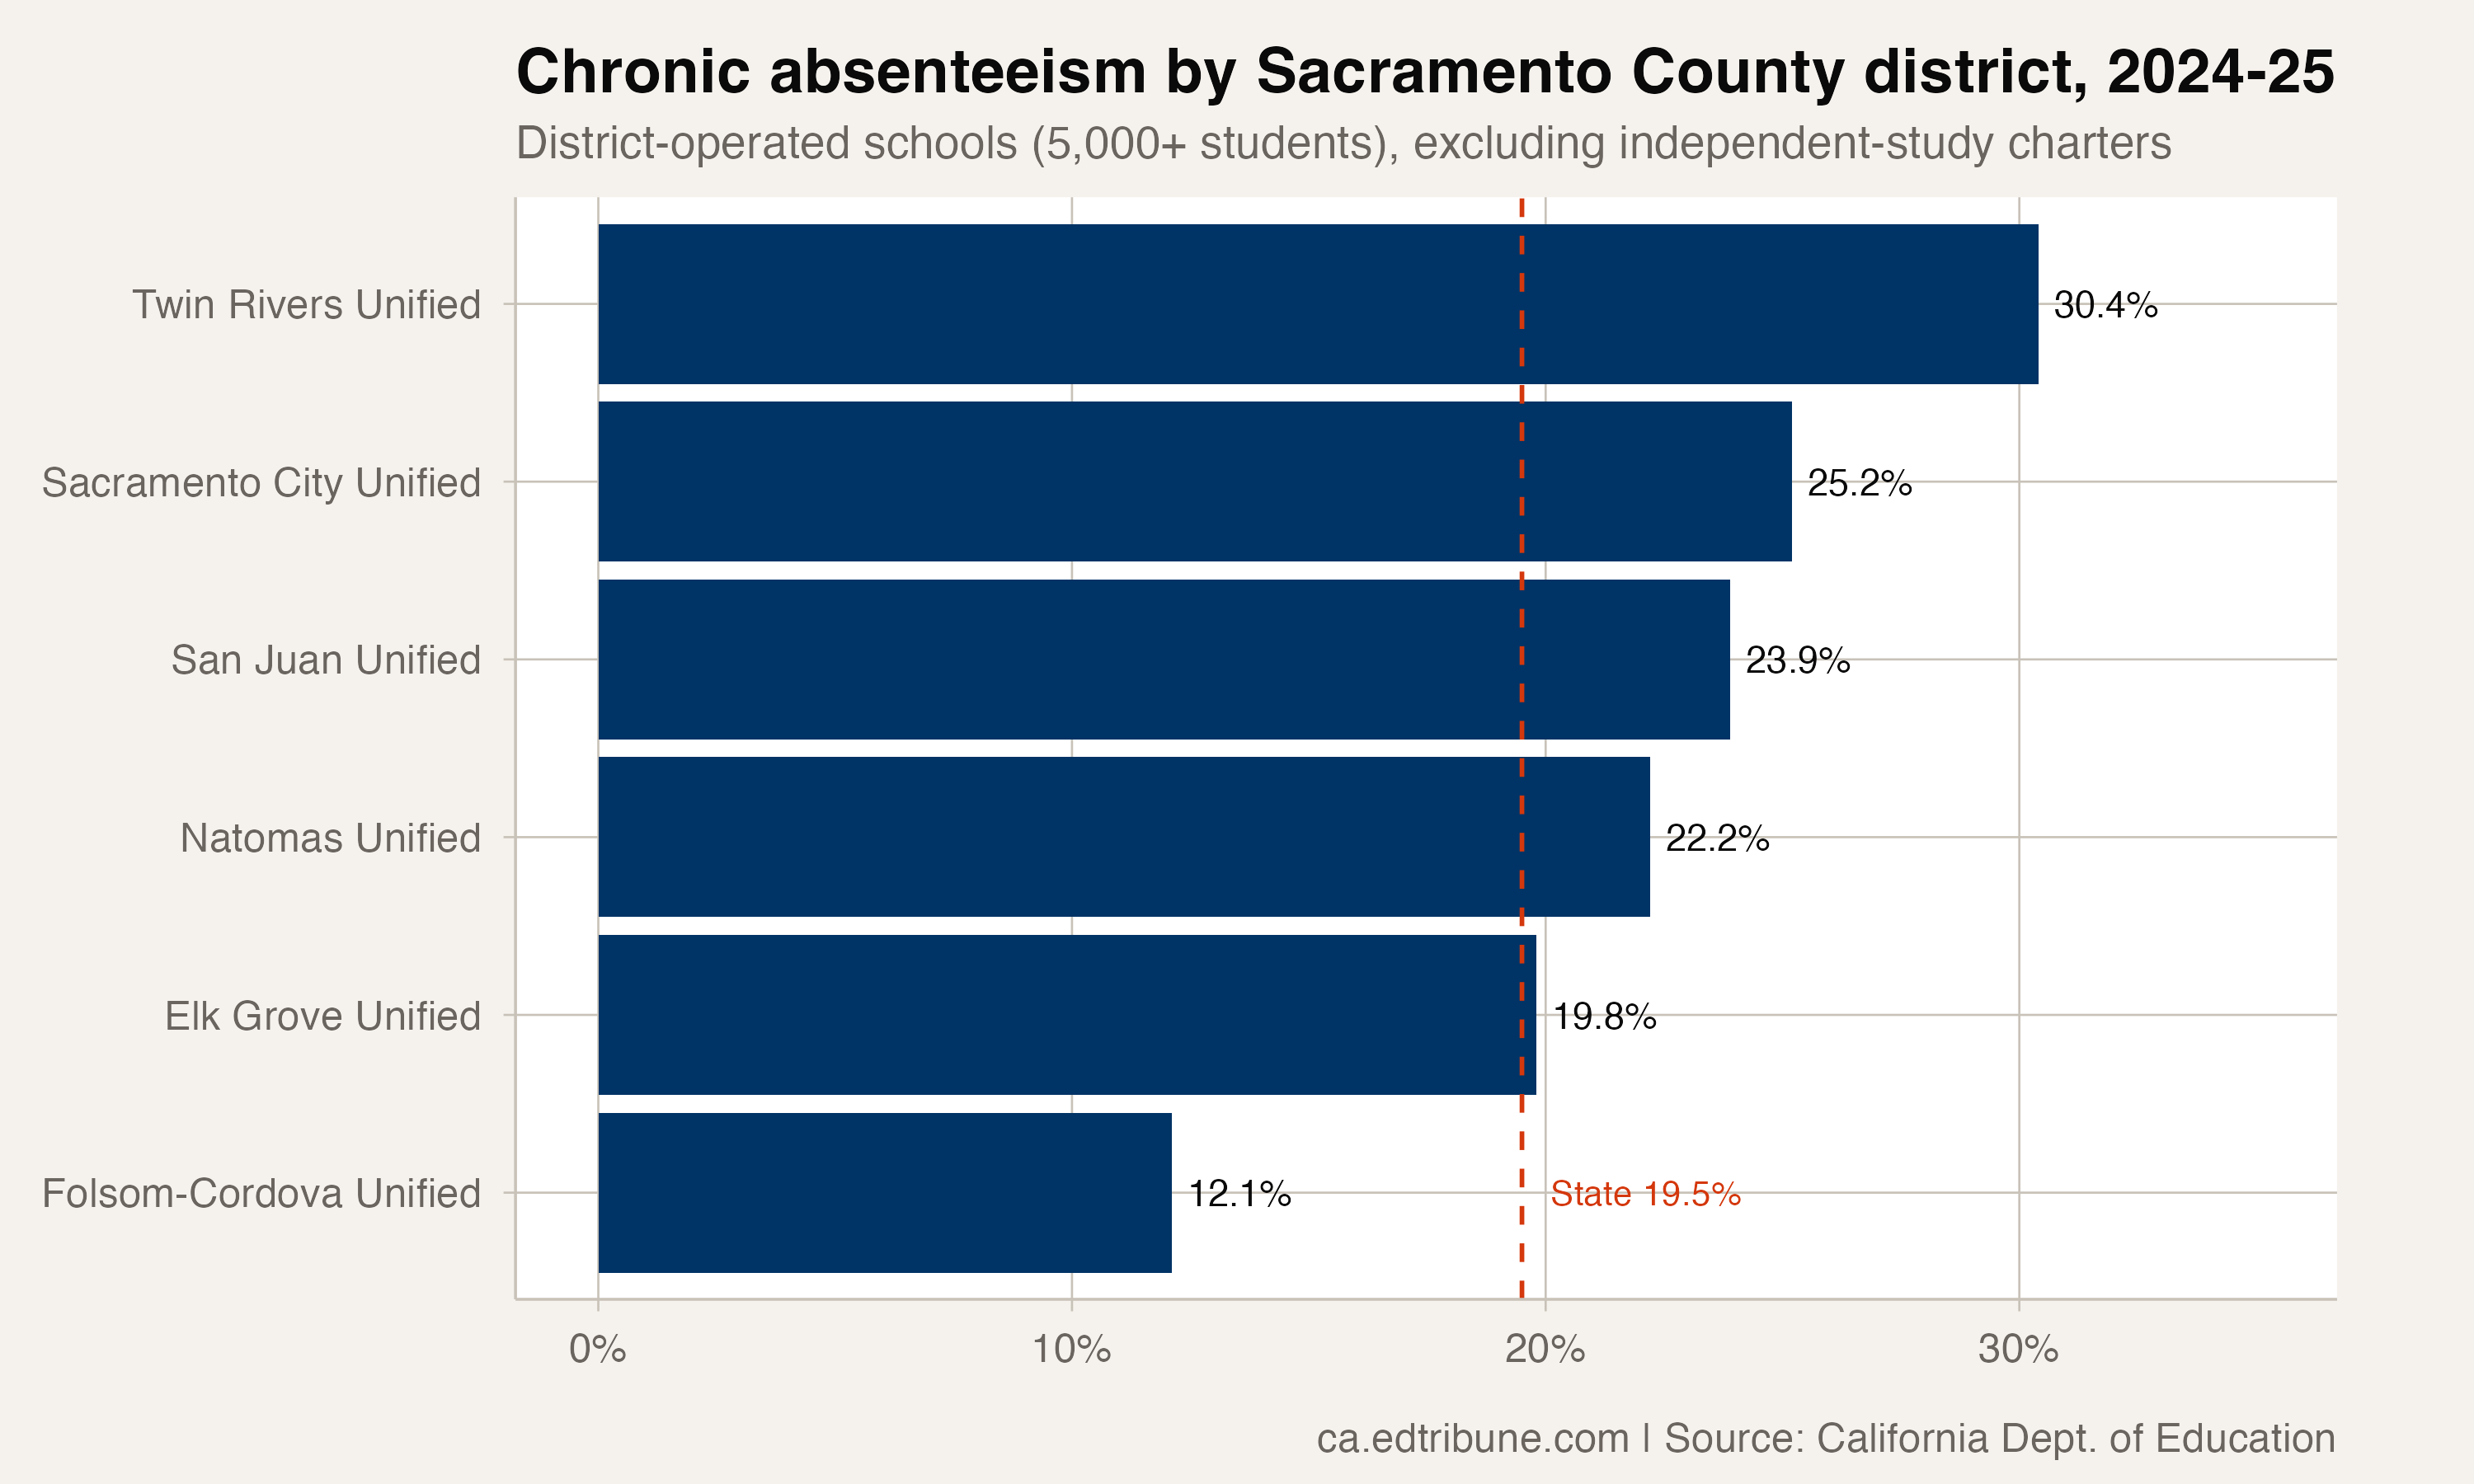
The Twin Rivers–Folsom-Cordova spread was 18.3 points. All six large districts were above their own 2018-19 rates. Their increases were 13.2 points in Twin Rivers, 8.0 in Sacramento City, 9.1 in San Juan, 9.1 in Natomas, 9.4 in Elk Grove and 2.8 in Folsom-Cordova.
Among smaller districts, Robla Elementary reported 2,002 eligible students and a 23.8% rate.
These are aggregate rates, not estimates of how moving an individual student across a district boundary would change that student's attendance. The file does not contain income, housing, transportation or policy measures capable of testing the geographic and socioeconomic explanations offered in the original article.
Detailed code that reproduces the analysis and figures in this article is available exclusively to EdTribune subscribers.
Discussion
Sign in to join the discussion.
Loading comments...