Correction (September 30, 2026): An earlier version of this article used the state's authorizer totals for each district, which add in students at charter schools the district authorizes, including independent-study charters that enroll students far outside its boundaries. It also counted county offices of education, which run court, community and alternative schools, as districts. Counting only the schools each district runs, 18 of 540 districts with at least 1,000 students have returned to their 2018-19 chronic absenteeism rates, not 45 of 607 (7.4%), and the typical district that has not recovered is 7.1 points above its old rate, not 6.8. Twin Rivers Unified's 2024-25 rate in its own schools is 30.4%, not 49.7%, and it is not the highest among districts with 10,000 or more students; Coachella Valley Unified is, at 36.2%. Duarte Unified's rate rose from 7.9% to 18.8%, not from 8.2% to 37.4%. The improvements credited to Meridian Elementary and Liberty Elementary came almost entirely from charter schools those districts authorize, so they were removed. We also removed comparisons with New Jersey and Kentucky that California's data cannot check. The headline, charts and text have been updated.
New Haven Unified↗ET, a district of 10,341 students in the East Bay, had a 48.4% chronic absenteeism rate in 2018-19, the last full school year before the pandemic. In 2024-25 its schools posted 20.5%, a drop of 27.9 points and the largest improvement of any California district in this analysis. In the high desert, Barstow Unified↗ET went the other way, from 22.3% to 47.7%.
Both trajectories are real. New Haven's is the rare one.
Few districts are all the way back
Of 540 California school districts with at least 1,000 students in their own schools and comparable data for 2018-19, 2021-22 and 2024-25, 18 have returned to their pre-pandemic chronic absenteeism rates. That is 3.3%. The other 522 are still above where they were six years earlier.
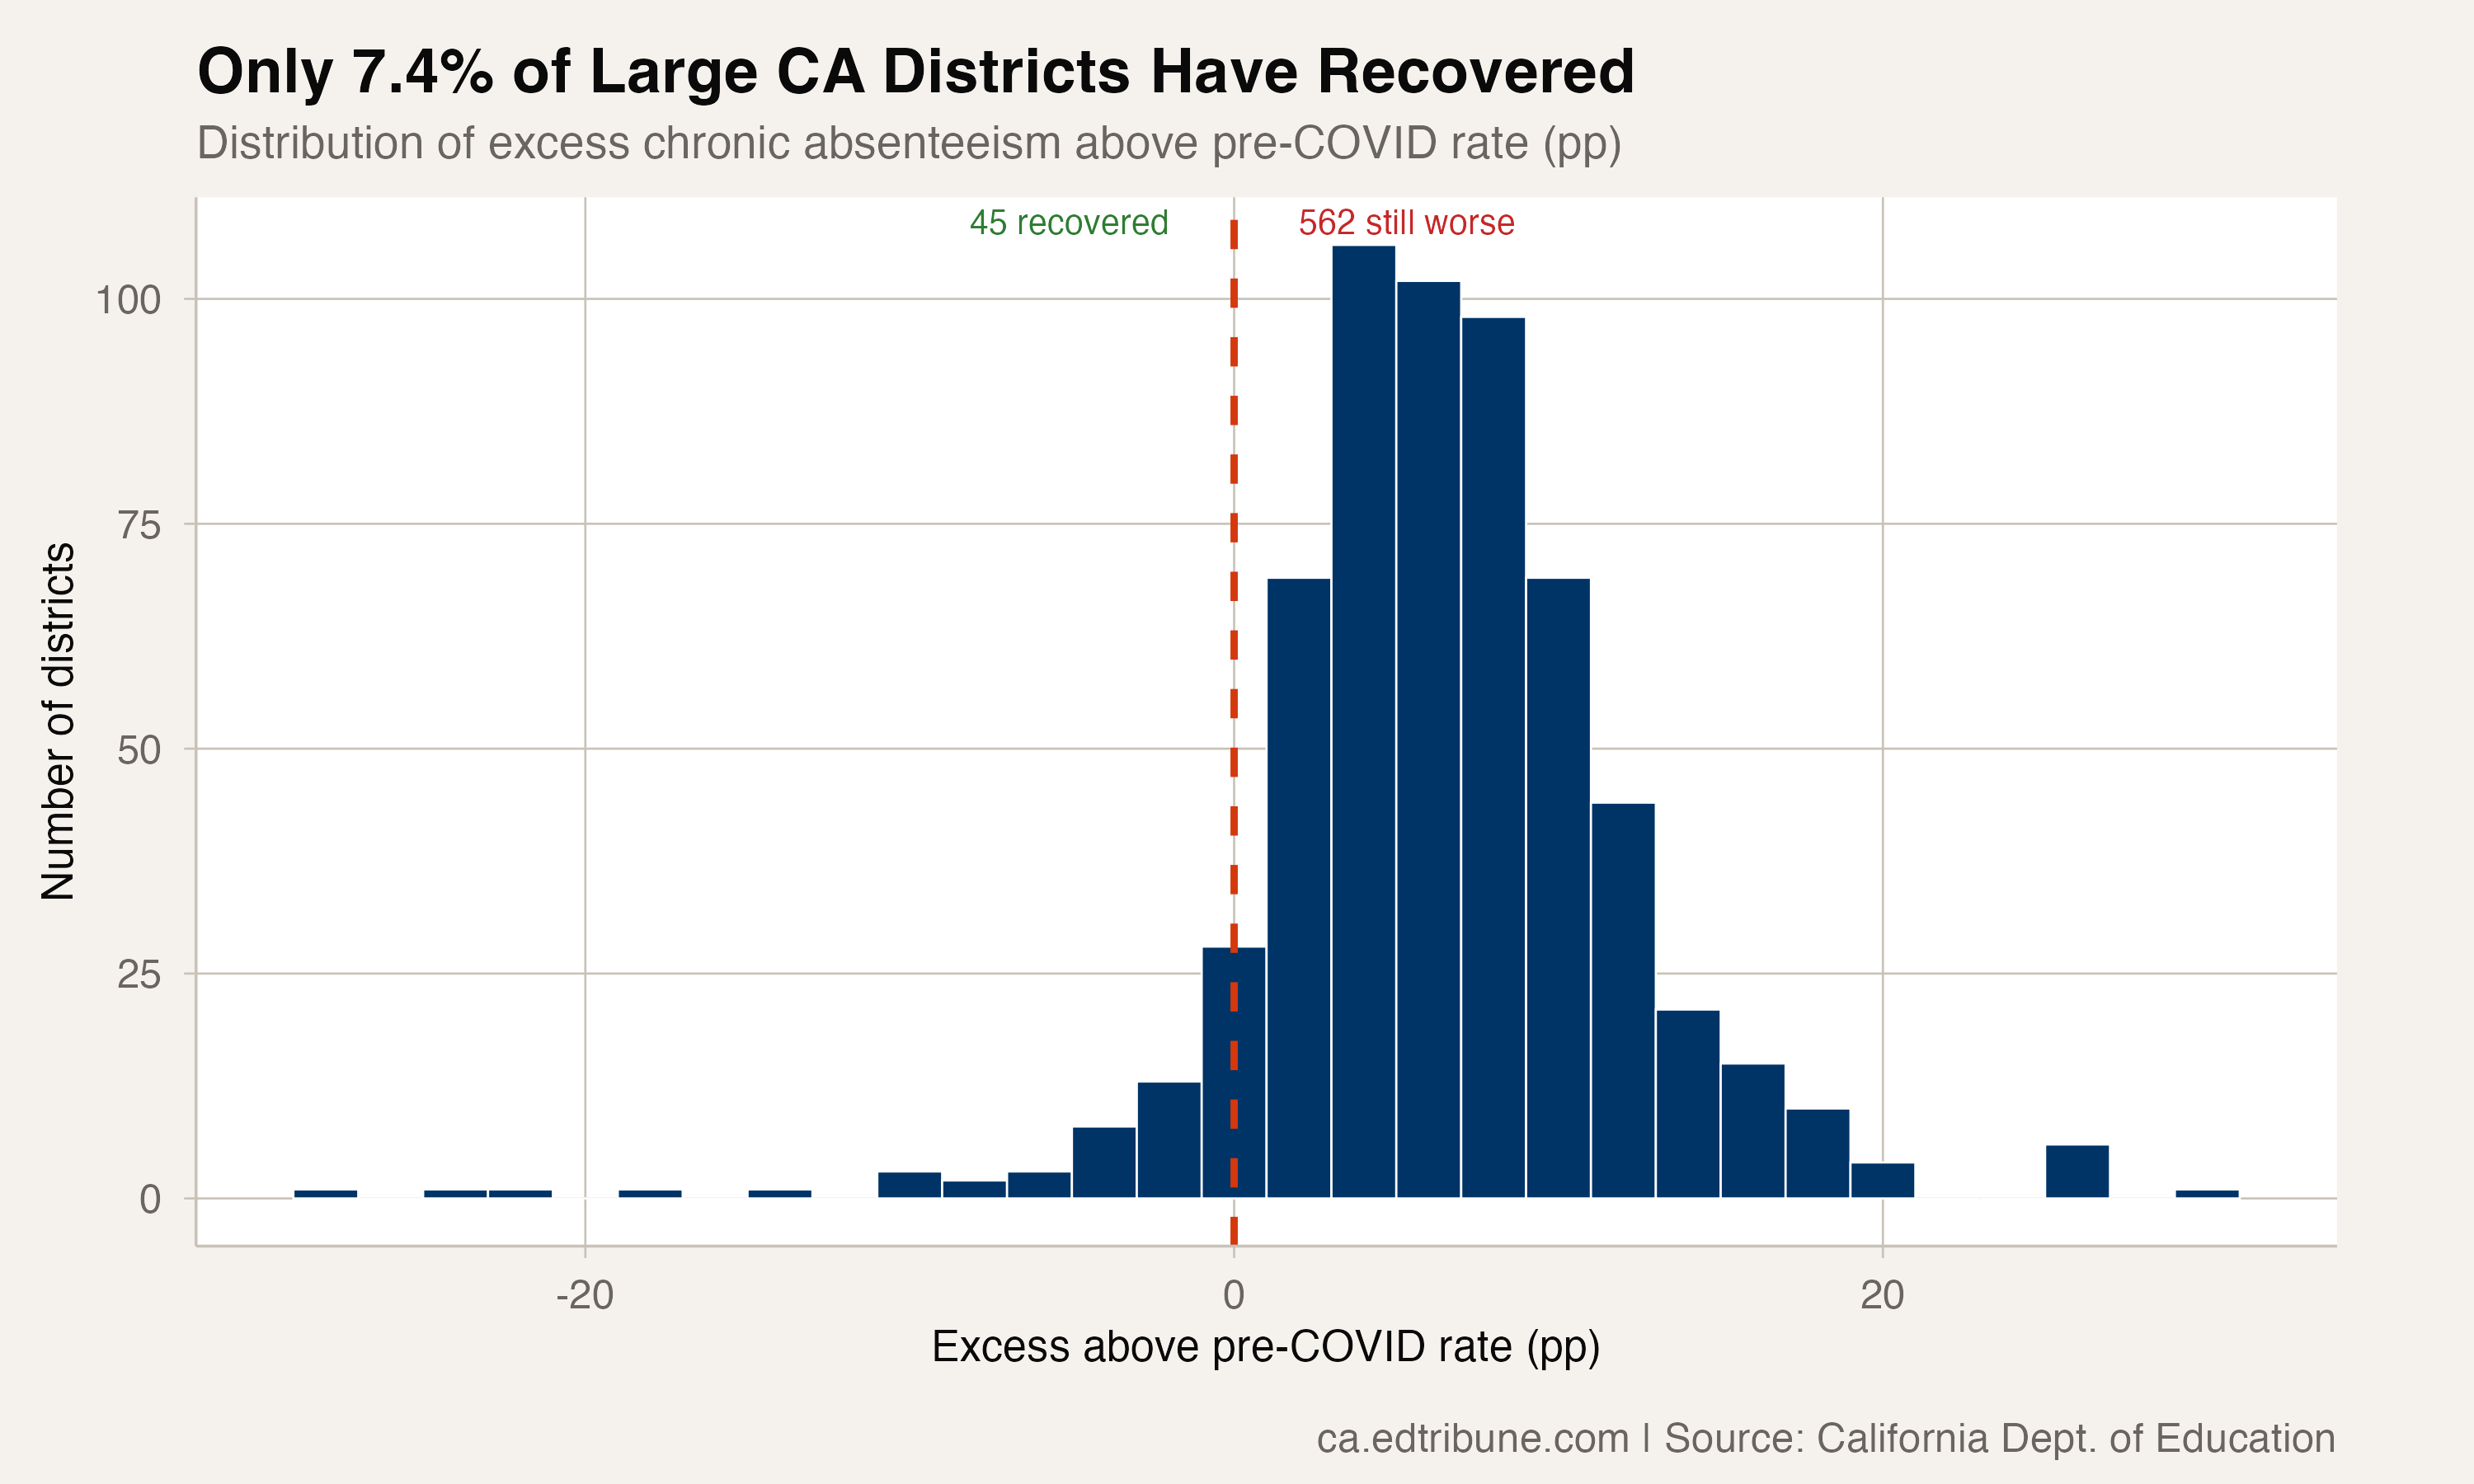
The median district that has not recovered sits 7.1 percentage points above its 2018-19 rate. These figures count only the schools each district runs. California also reports a larger total for each district that folds in the charter schools it authorizes, some of them independent-study programs with students across the state, and that total can make a district look better or worse than its own classrooms.
Most districts are partway there
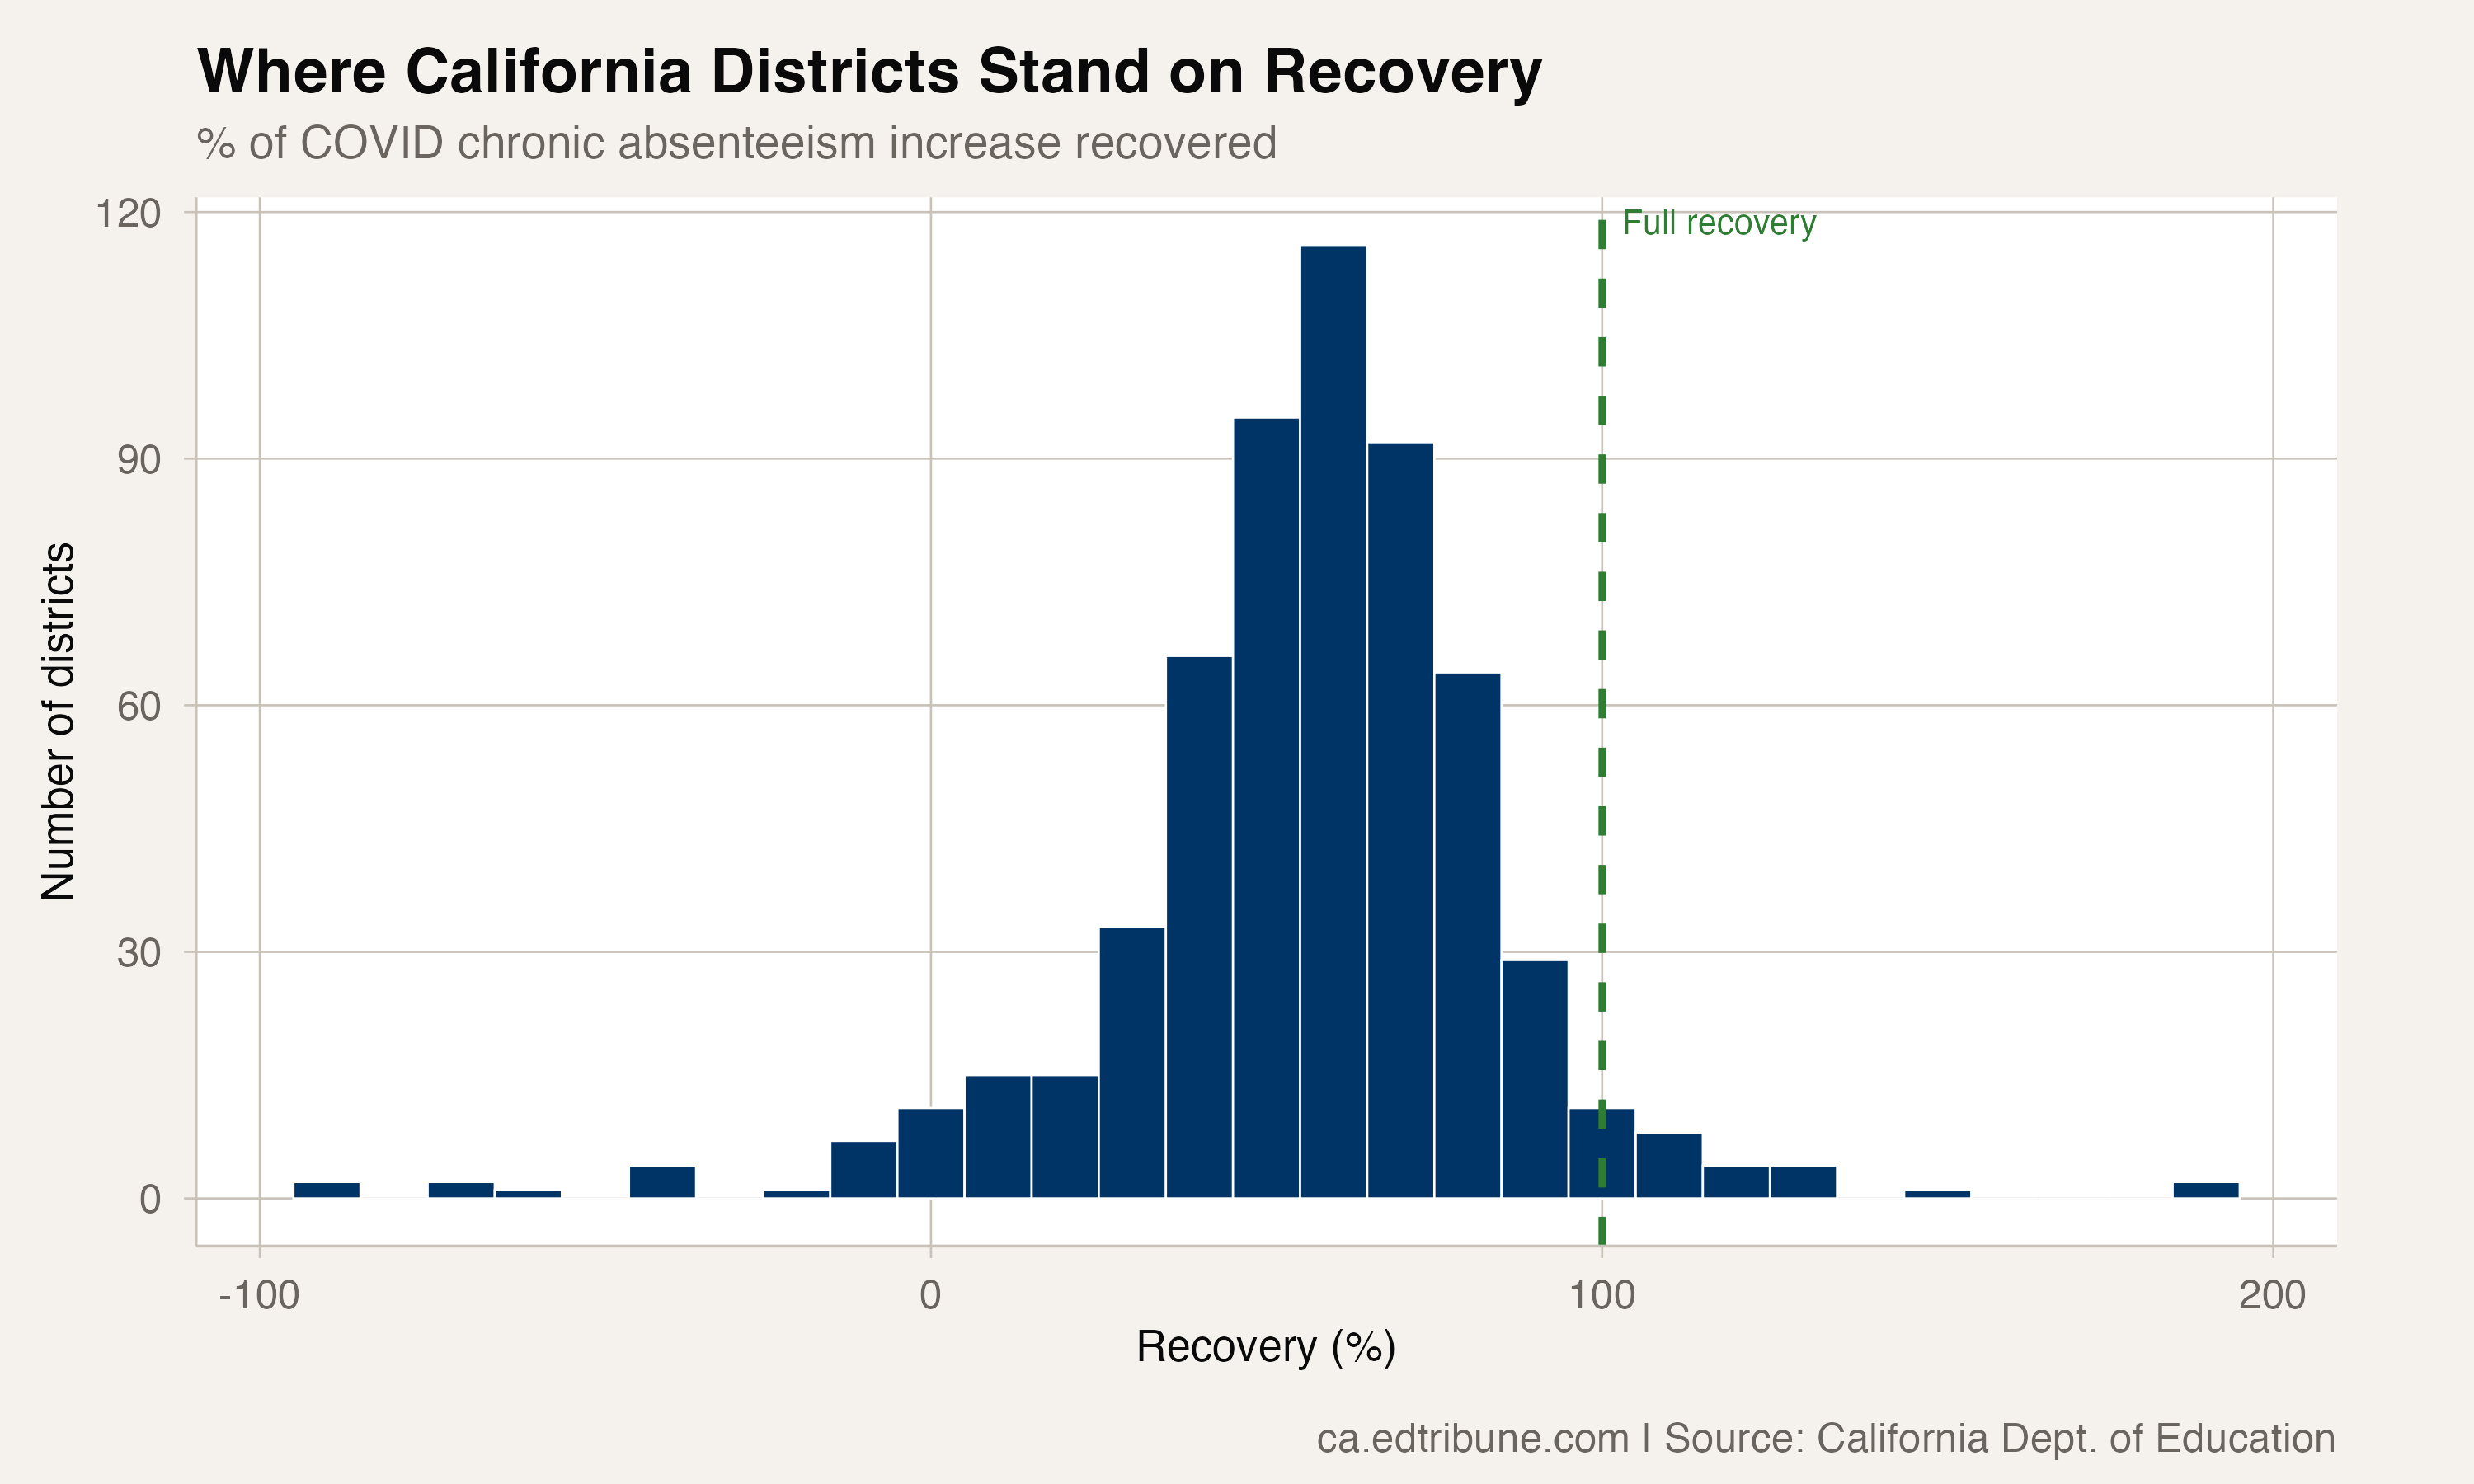
Among the 535 districts whose rate rose between 2018-19 and 2021-22, the median district has since reversed 58% of that increase. Most sit in a middle band: 360 districts, or 67.3%, have undone between 40% and 80% of the rise. That is real progress, and it still leaves them short of where they started.
Where the rates are highest
Among the 148 districts with 10,000 or more students, Coachella Valley Unified↗ET in Riverside County has the highest rate, 36.2%, about double its 18.0% in 2018-19. Hesperia Unified↗ET in San Bernardino County has moved furthest from its own baseline of any district that size, from 14.7% to 34.8%. Barstow's rise is the third largest of all 540 districts.
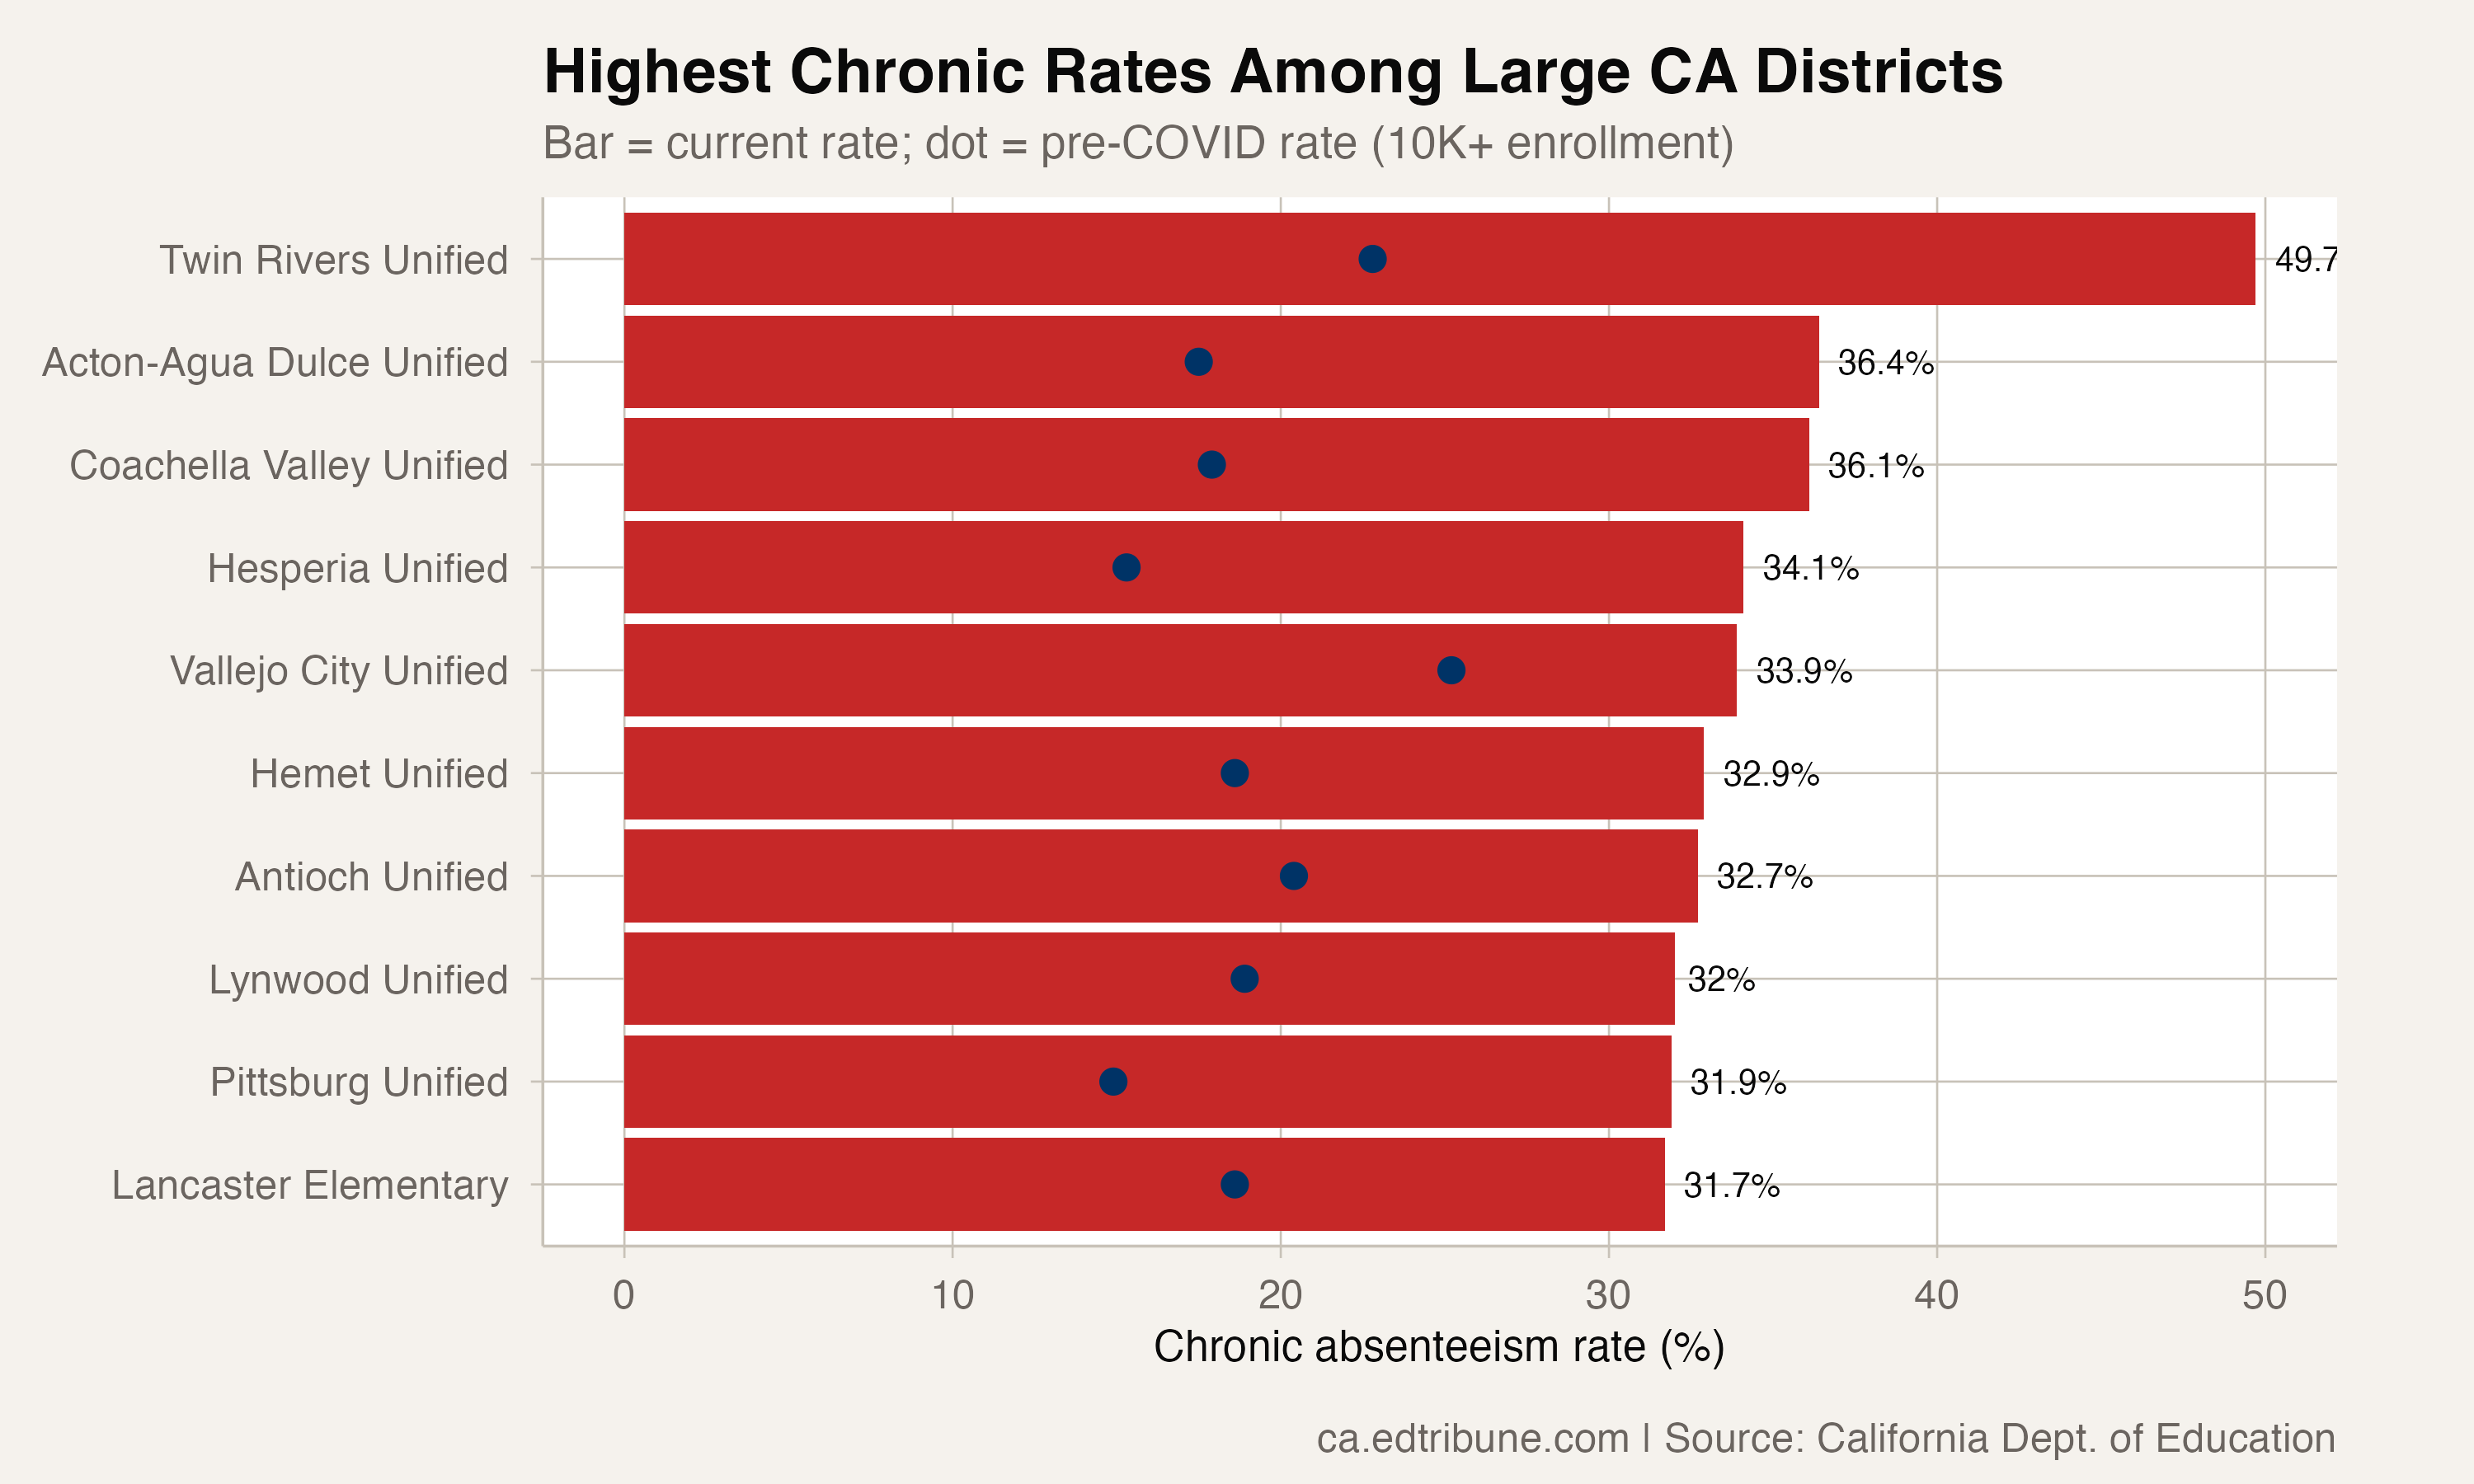
Only three of those 148 larger districts are back to their 2018-19 rates.
Size does not predict recovery
Plotting each district's enrollment against how far it remains above its old rate produces a cloud, not a line. The rank correlation between the two is 0.13, close to none.
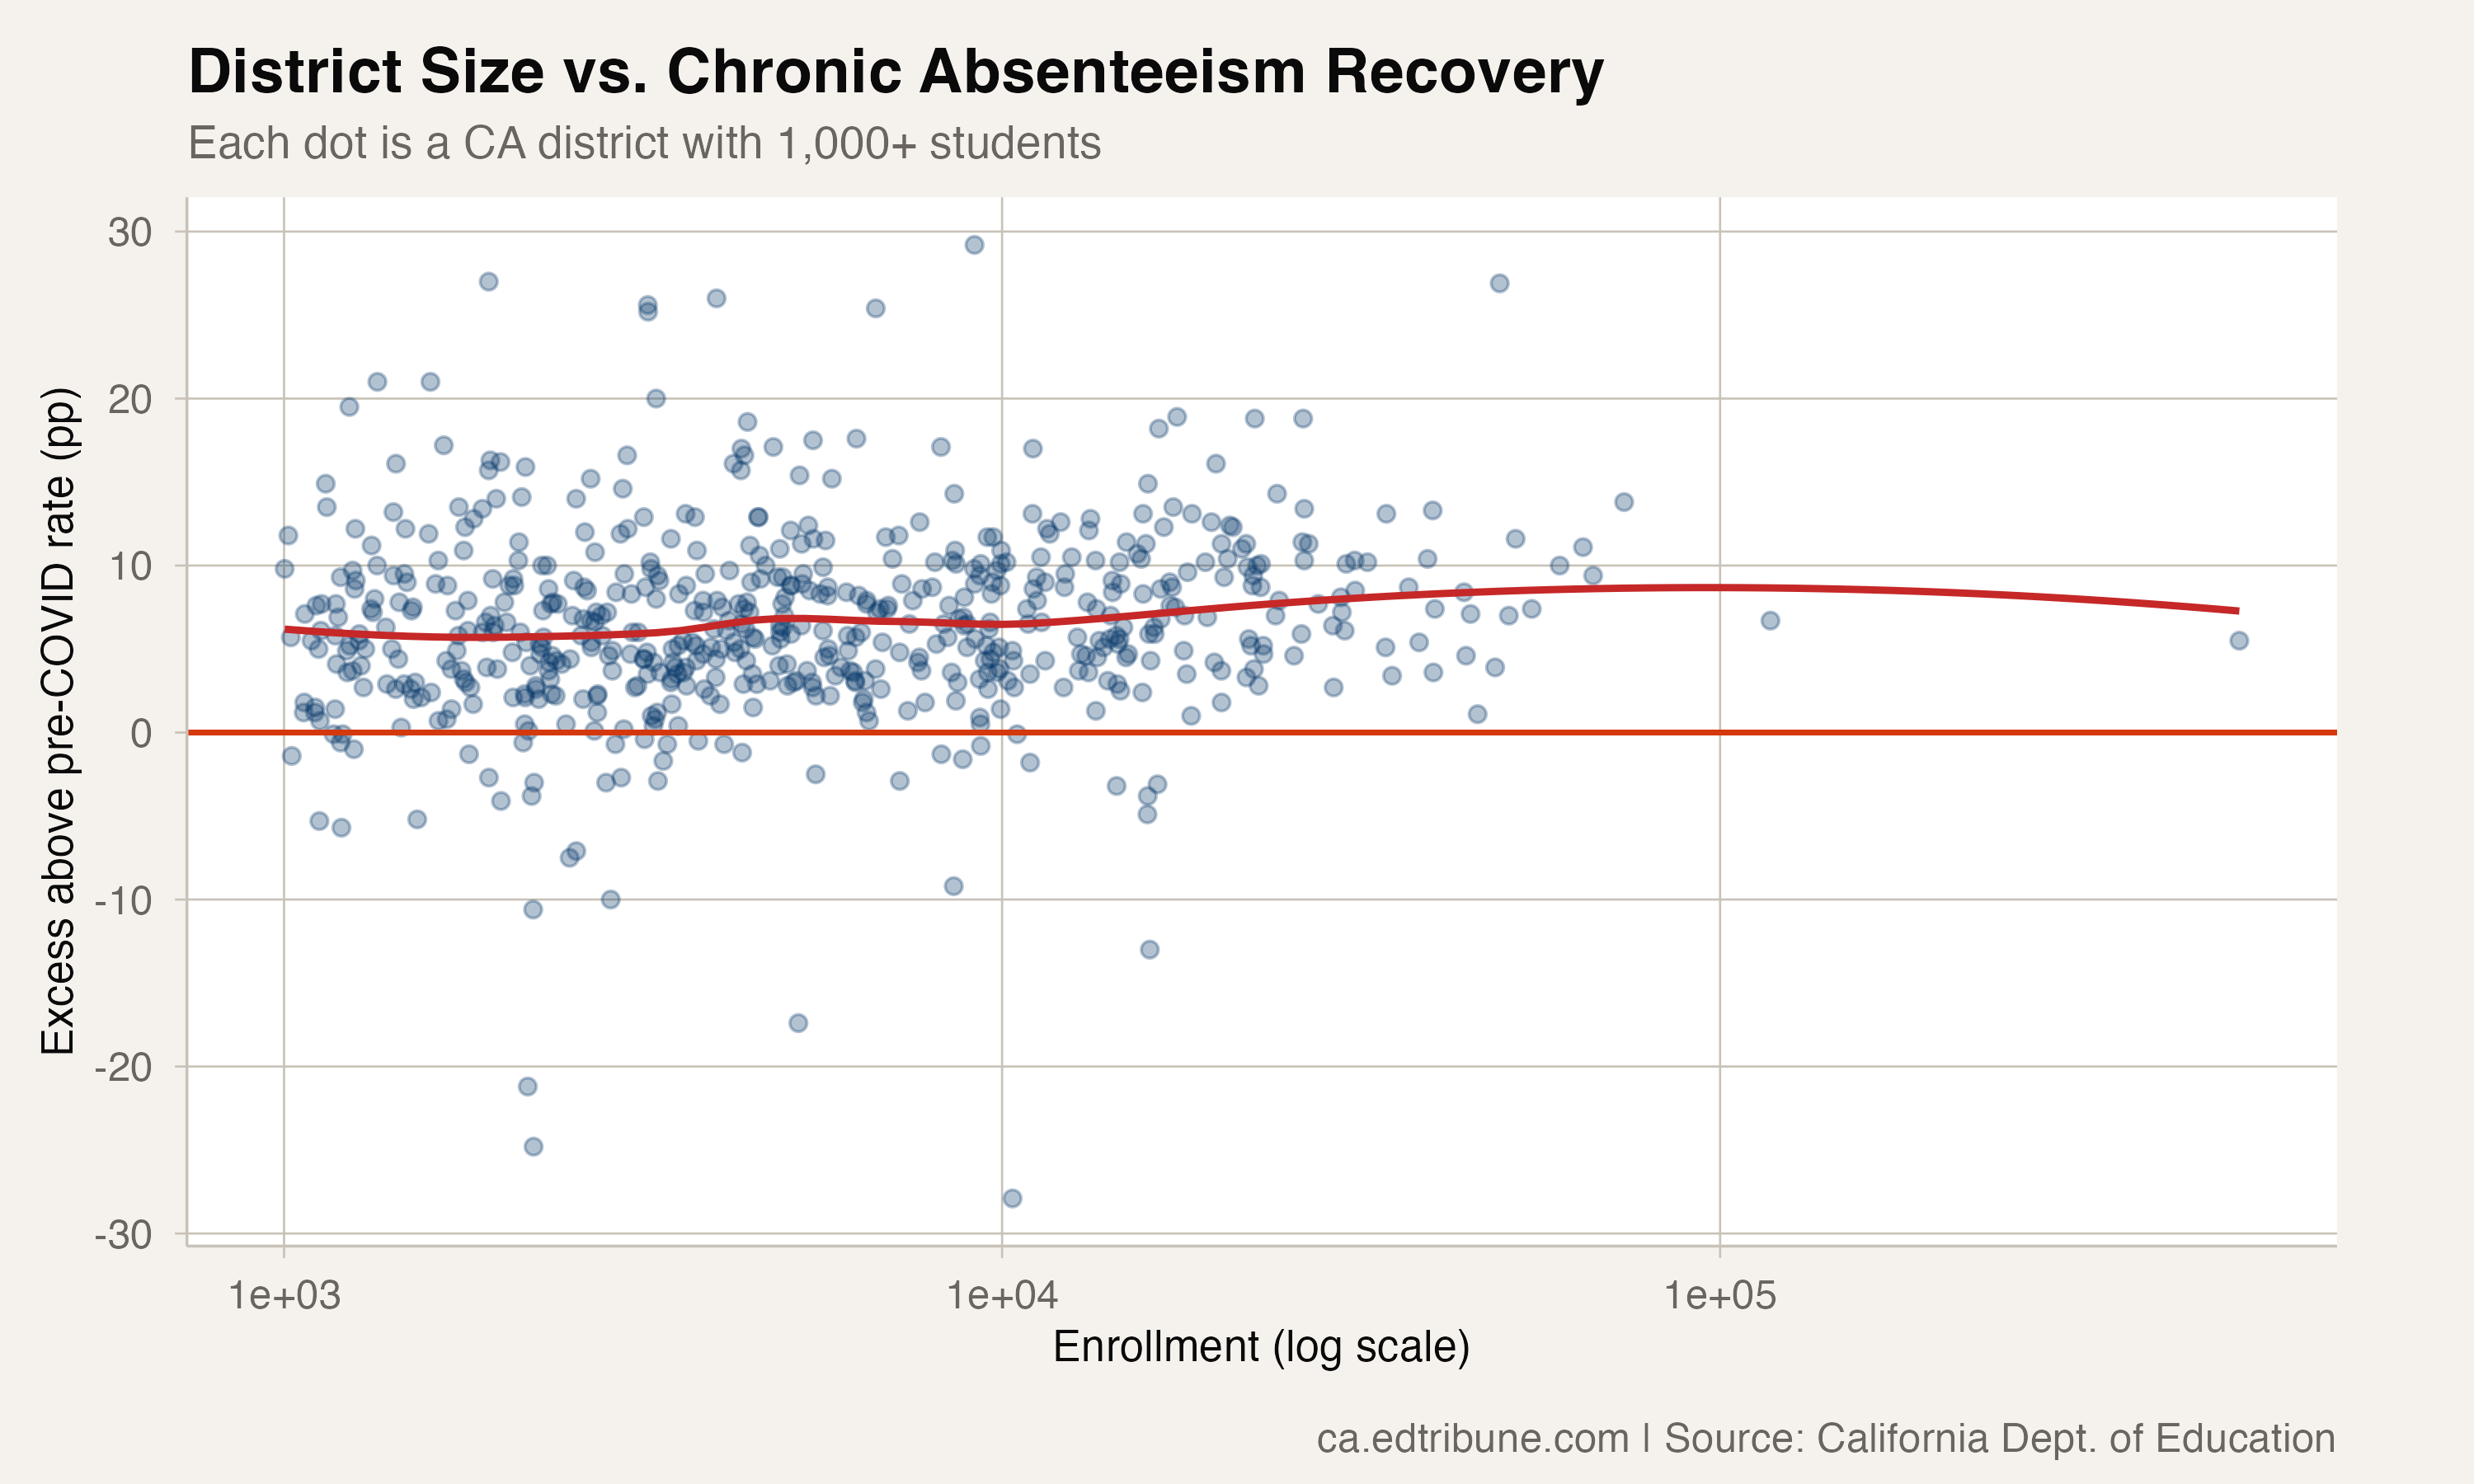
The smallest districts swing the most in both directions, which is what small numbers do. Beyond that, whatever separates the districts that recovered from the rest, it is not size.
The districts that made it back
The 18 recovered districts range from 1,025 to 35,065 students. Compton Unified↗ET, with 17,145 students, went from 13.9% before the pandemic to 32.9% in 2021-22 and down to 12.2% in 2024-25. Mendota Unified↗ET in Fresno County climbed from 12.0% to 42.7% and is now at 11.3%.
Recovery here is measured against each district's own starting point, so it does not always mean a low rate. Oakland Unified↗ET counts as recovered at 32.2%, just under the 34.4% it posted before the pandemic, and it is still among the highest rates of any large district in the state.
What the recovered districts share is not visible in the attendance data. They span different regions, sizes and student populations, and the state's files record the results, not what each district did to get there.
What the state is spending
California's $4.1 billion community schools investment, launched in 2021, aims at the causes of disengagement, such as housing instability, food insecurity and mental health, through wraparound services. The attendance files cannot say whether it is working, because they do not record which schools take part.
They do show where the state stands. Three years into that investment, 522 of 540 districts remain above their pre-pandemic chronic absenteeism rates. The 18 that are not show that the old level can be reached again, and every other district is still working out how.
Detailed code that reproduces the analysis and figures in this article is available exclusively to EdTribune subscribers.
Discussion
Sign in to join the discussion.
Loading comments...