Correction (July 20, 2026): An earlier version misstated several subgroup rates while reporting the correct 2019-to-2025 changes for four highlighted gaps. Pacific Islander and white rates in 2018-19 were 20.2% and 9.9%, not 19.5% and 9.2%. Current Asian and Filipino rates are 8.1% and 9.1%, not 8.0% and 12.9%; the white peak was 23.2%, not 22.3%. Black chronic absenteeism rose from 22.5% in 2018-19 to 31.3% in 2024-25, peaking at 42.5%, rather than remaining roughly unchanged around 31%.
Correction (July 21, 2026): A prior correction still omitted multiracial students from the groups above the white rate. Their 2024-25 rate was 16.5%, compared with 15.1% for white students; that 1.4-point gap was 0.3 points wider than in 2018-19. There are five above-white gaps, not four. The headline and body now describe measured changes without attributing them to COVID or other mechanisms the statewide file does not test. External housing, transportation, mental-health, program and predictive context was removed.
In 2018-19, Pacific Islander students in California were chronically absent at a rate of 20.2%. White students were at 9.9%. The gap was 10.3 percentage points, smaller than the Black-white gap that year.
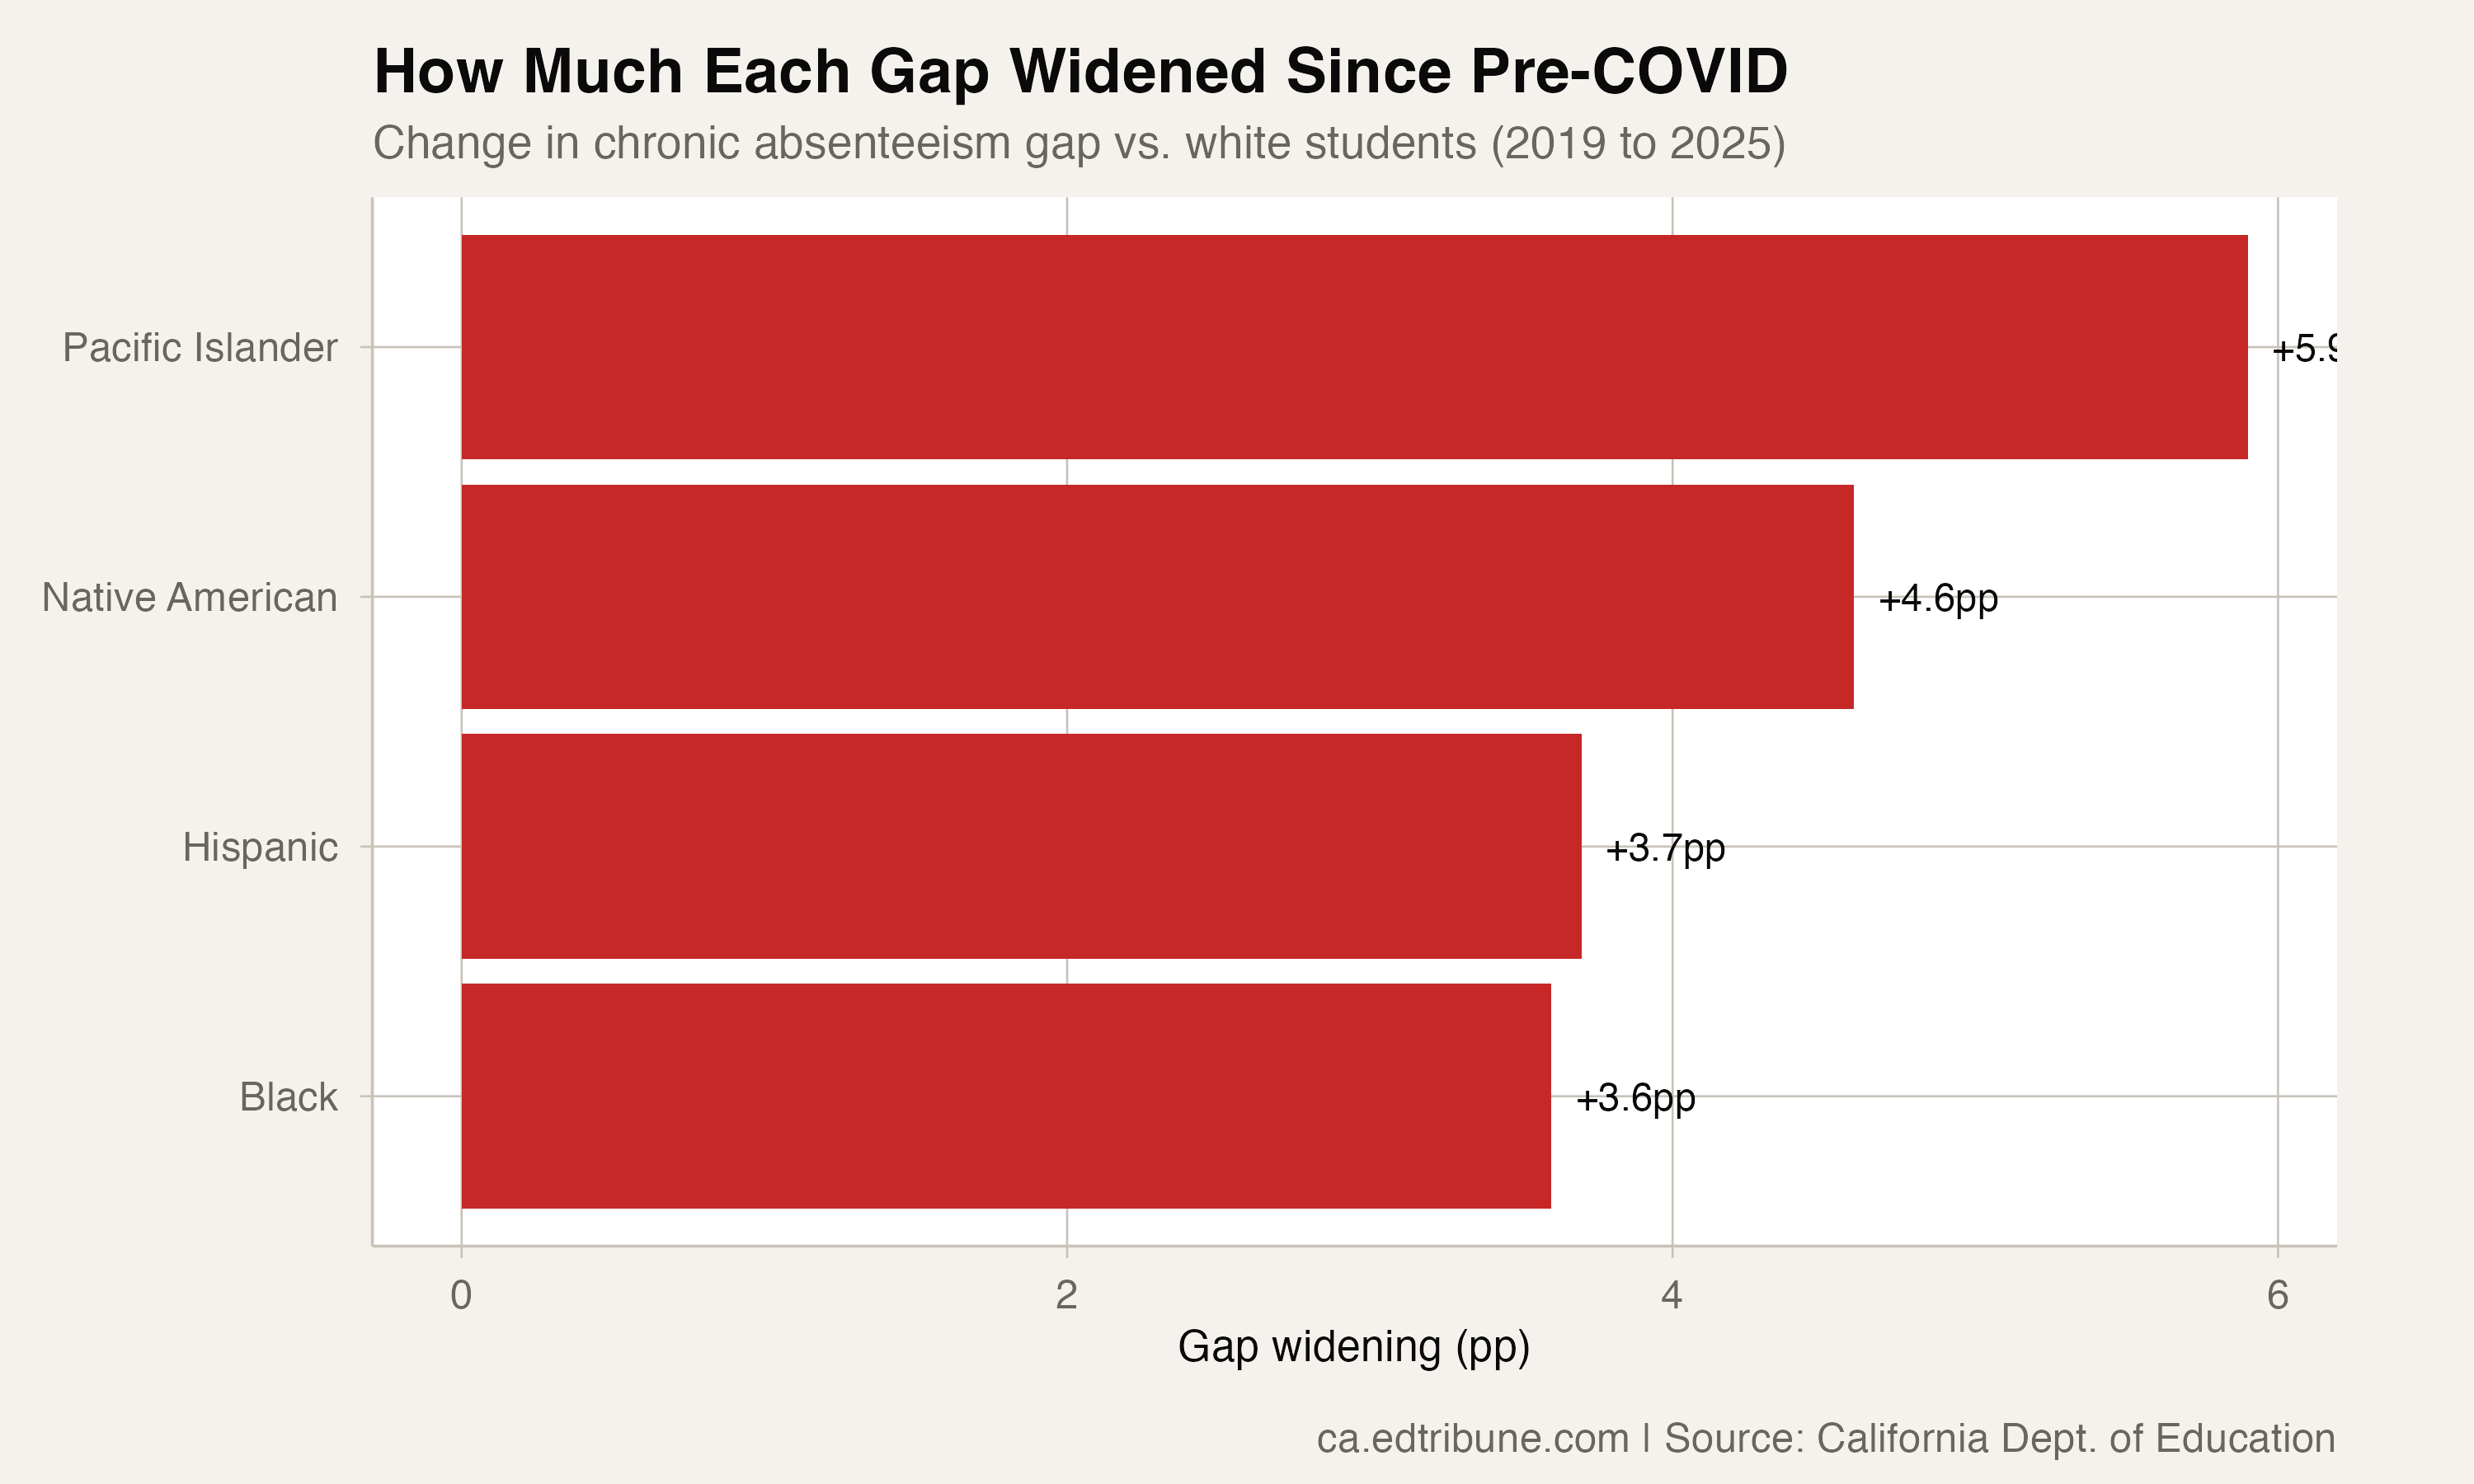
Six years later, Pacific Islander students are at 31.3%. White students are at 15.1%. The gap has grown to 16.2 points, a 5.9-point expansion, the largest among the five groups whose current rates exceed the white rate.
Five gaps remain wider than in 2019
Five reported groups have chronic absenteeism rates above the white rate: Black, Hispanic, multiracial, Native American, and Pacific Islander students. Each gap is wider in 2024-25 than it was in 2018-19.
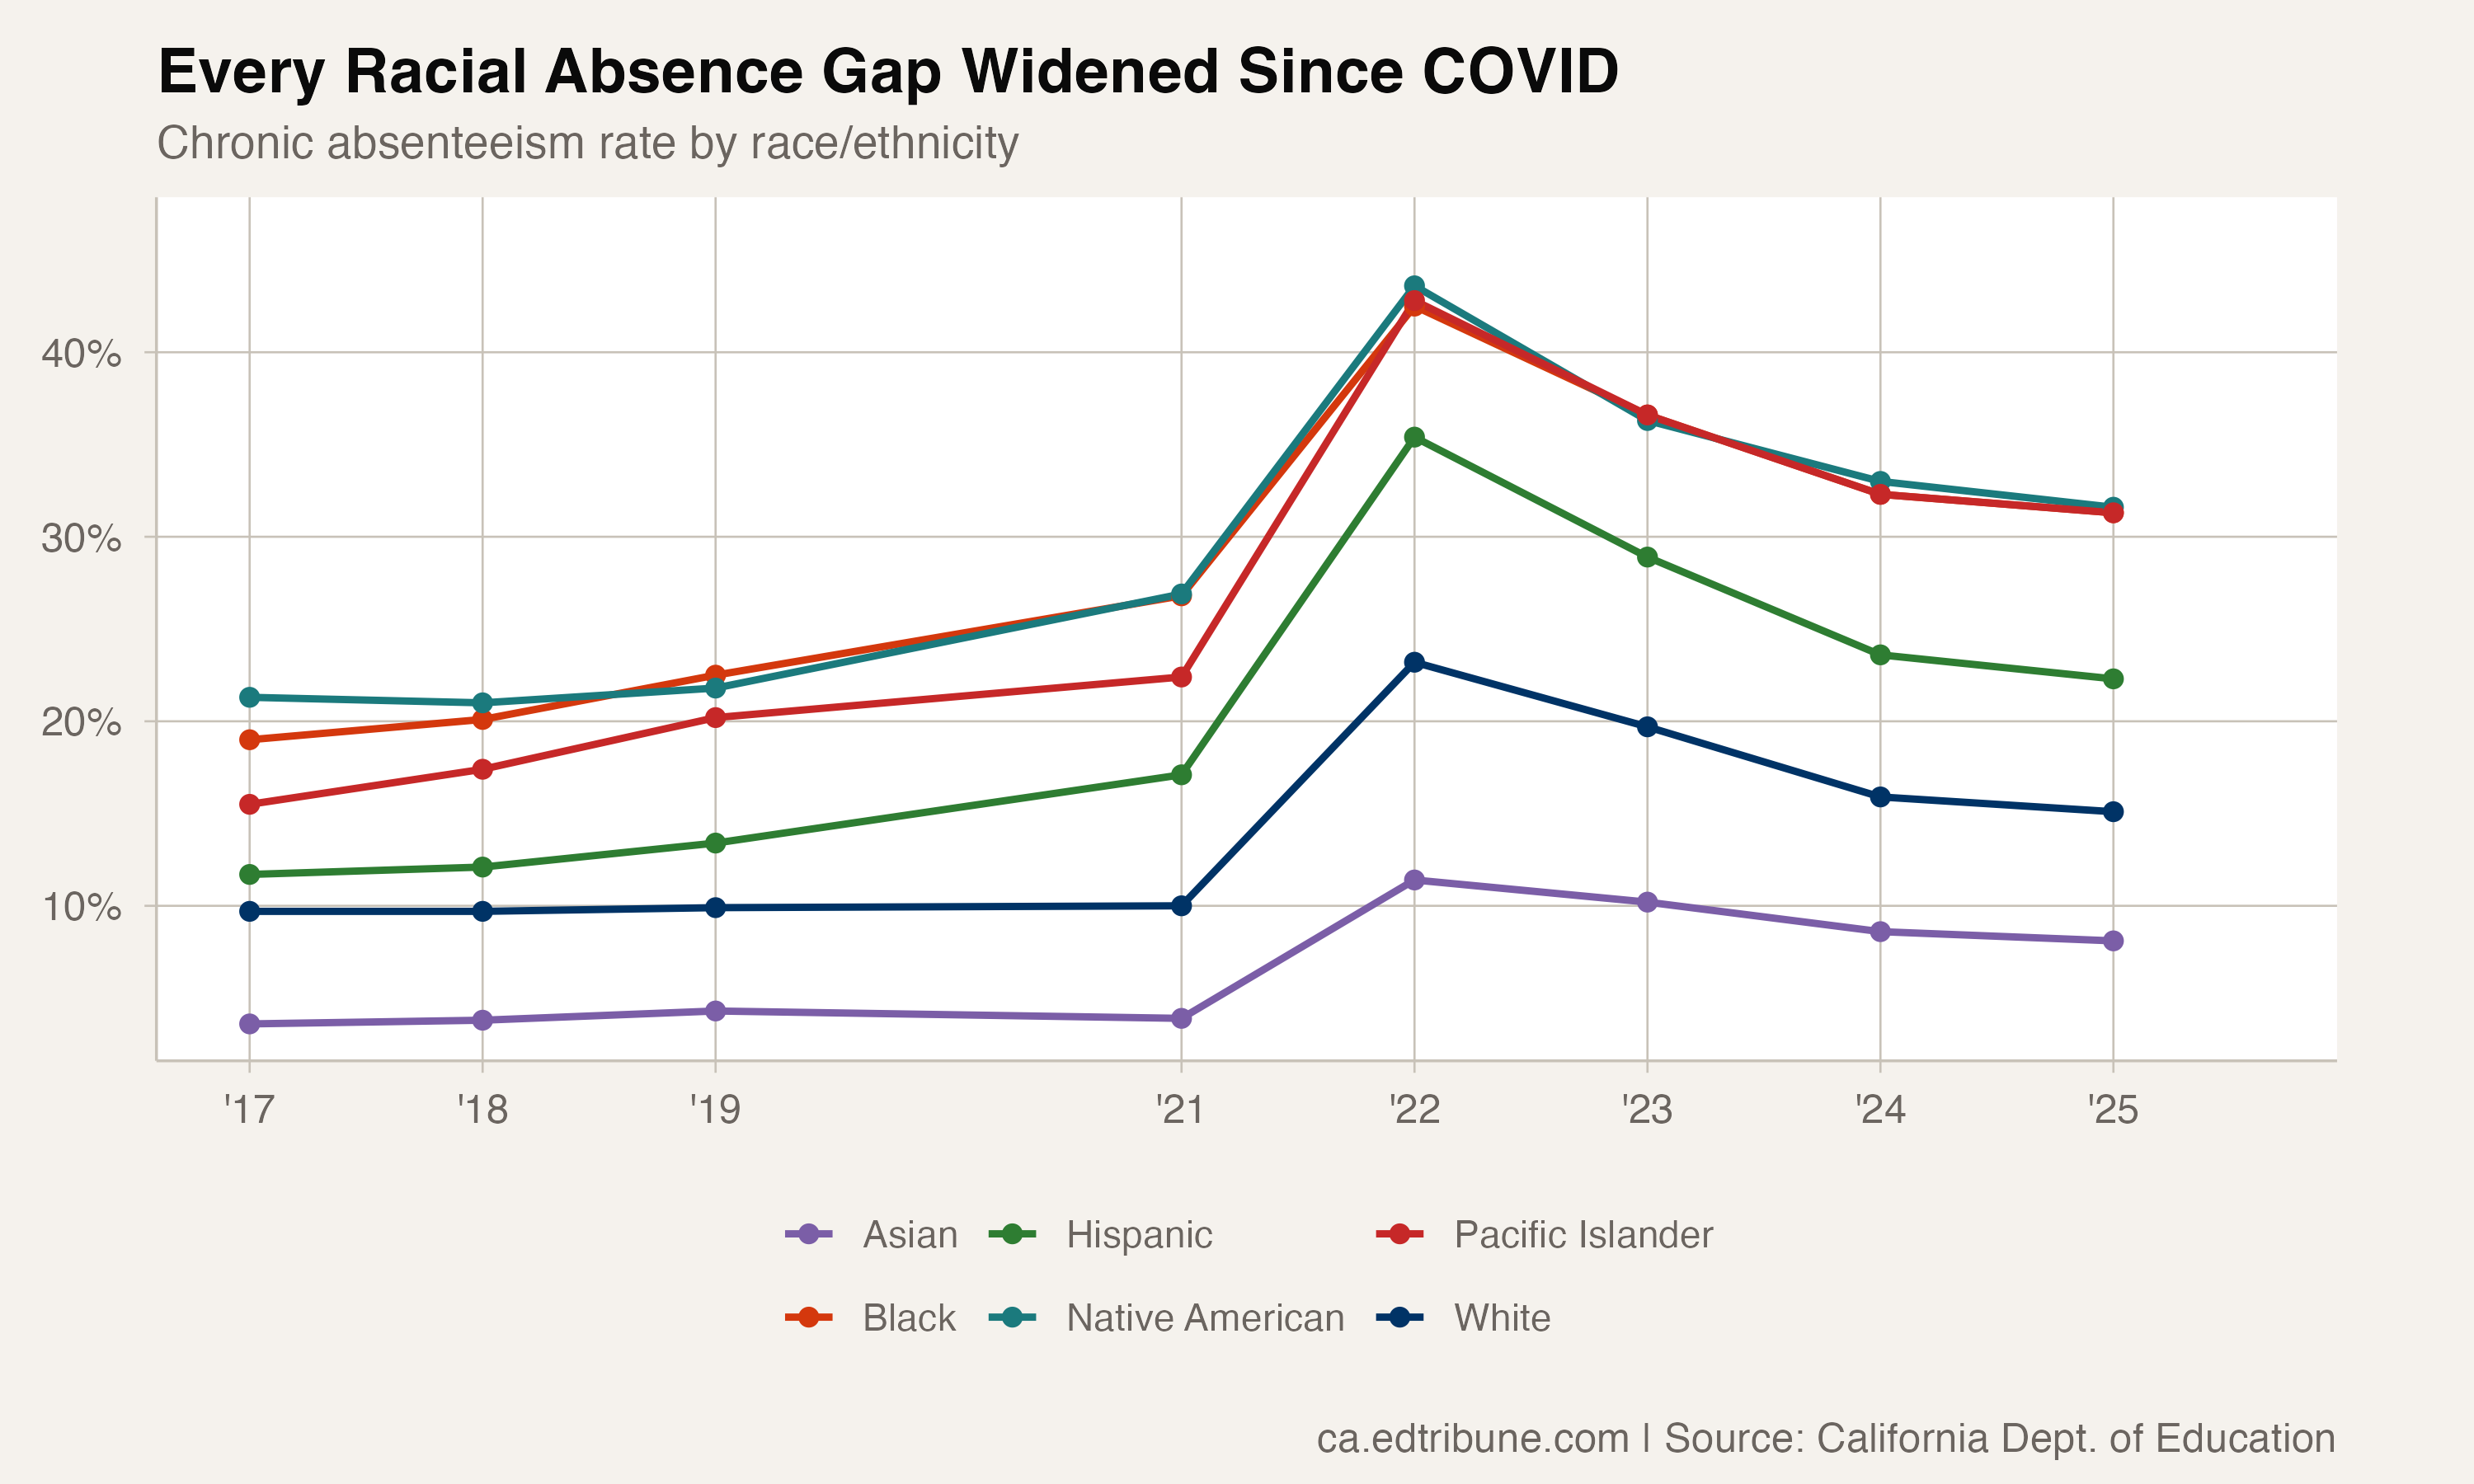
Pacific Islanders saw the largest gap expansion: +5.9 percentage points (from 10.3 to 16.2). Native American students are close behind at +4.6 points (from 11.9 to 16.5). The Hispanic-white gap nearly doubled, from 3.5 to 7.2 points. The Black-white gap grew 3.6 points, from 12.6 to 16.2.
The multiracial-white gap is much smaller but moved in the same direction, from 1.1 points in 2019 to 1.4 points in 2025, a 0.3-point increase.
Each of the four larger gaps peaked in 2022 and narrowed by 2025, but none returned to its 2019 level. The multiracial-white gap also remained above its 2019 level.
One in three Black, Native American, and Pacific Islander students
The current numbers converge on a disturbing threshold. Black students: 31.3% chronically absent. Native American students: 31.6%. Pacific Islander students: 31.3%. Three groups, three different histories in California, and all landing at essentially the same rate -- roughly one in three.
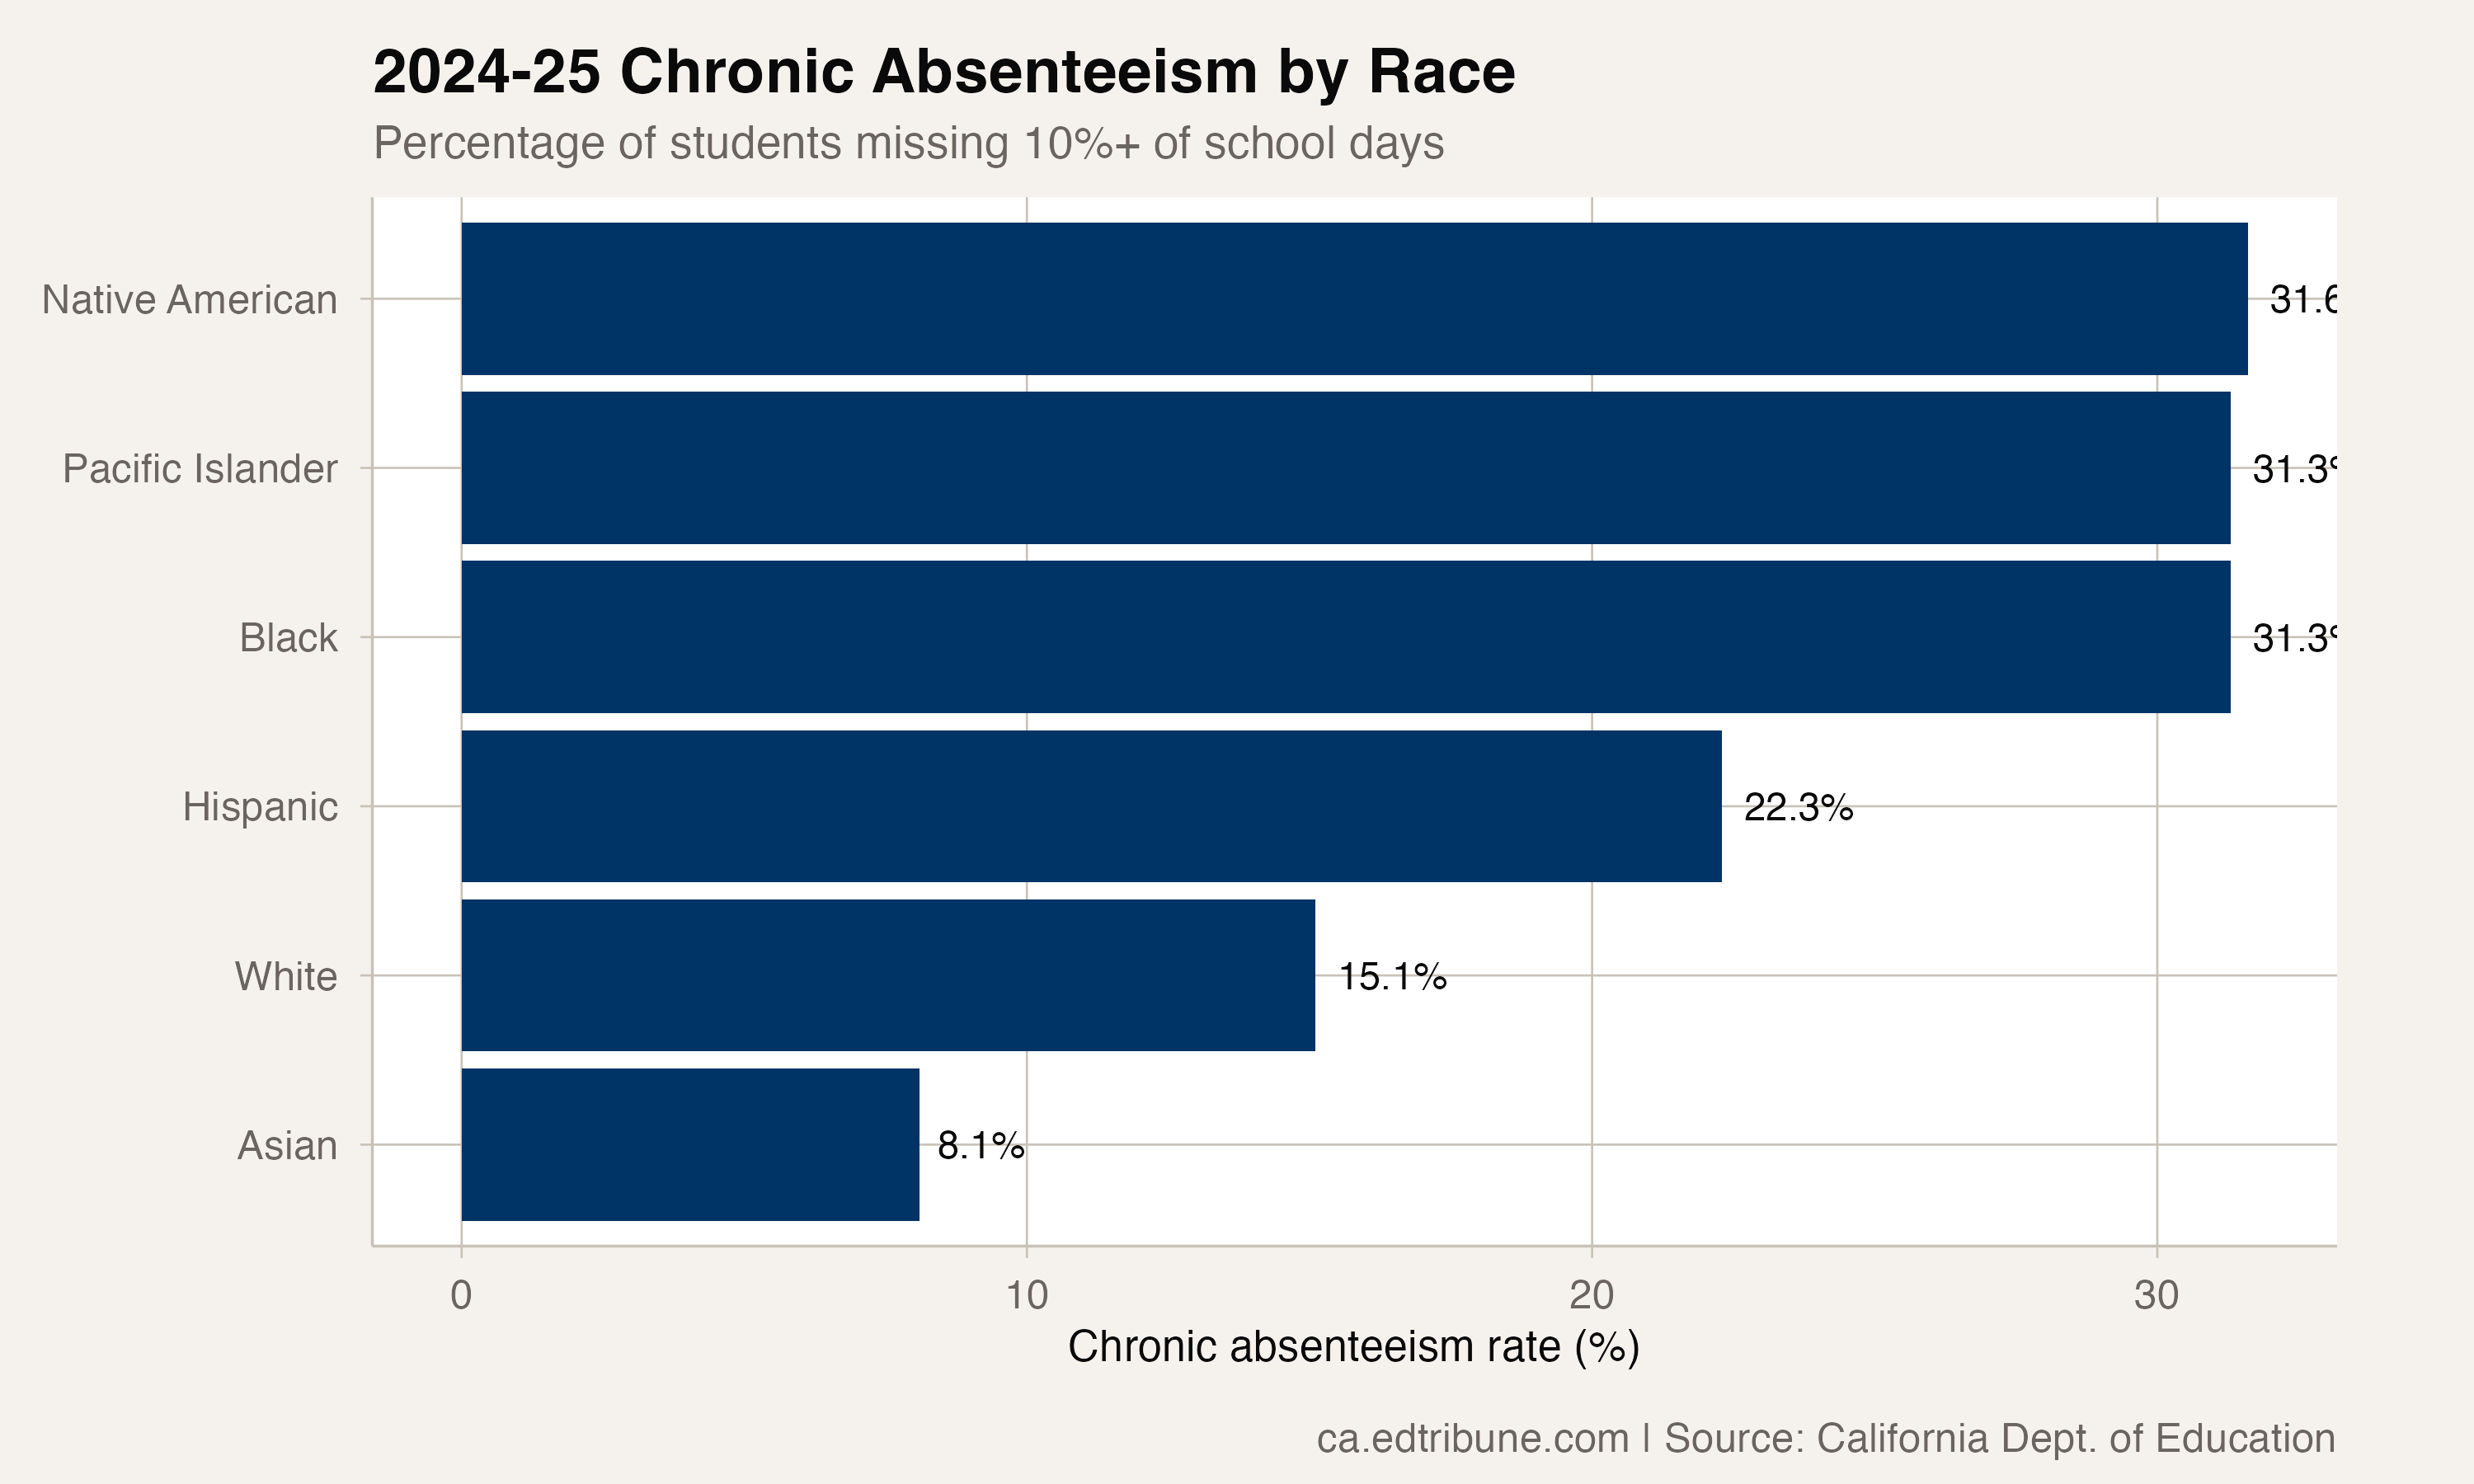
Asian students remain the lowest at 8.1%, above their pre-COVID rate of 4.3%. Filipino students are at 9.1%. White students at 15.1% have recovered more than half of their COVID-era increase (they peaked at 23.2% in 2022).
Hispanic students, at 22.3%, carry the greatest absolute burden. They are the largest student group in California at roughly 57% of the enrollment represented by these eight race and ethnicity categories. The package reports 739,261 chronically absent Hispanic students, compared with 391,275 across the other seven categories combined.
The Black-white gap
The Black-white chronic absenteeism gap tells a particularly clear story of pre-existing inequity made worse by crisis.
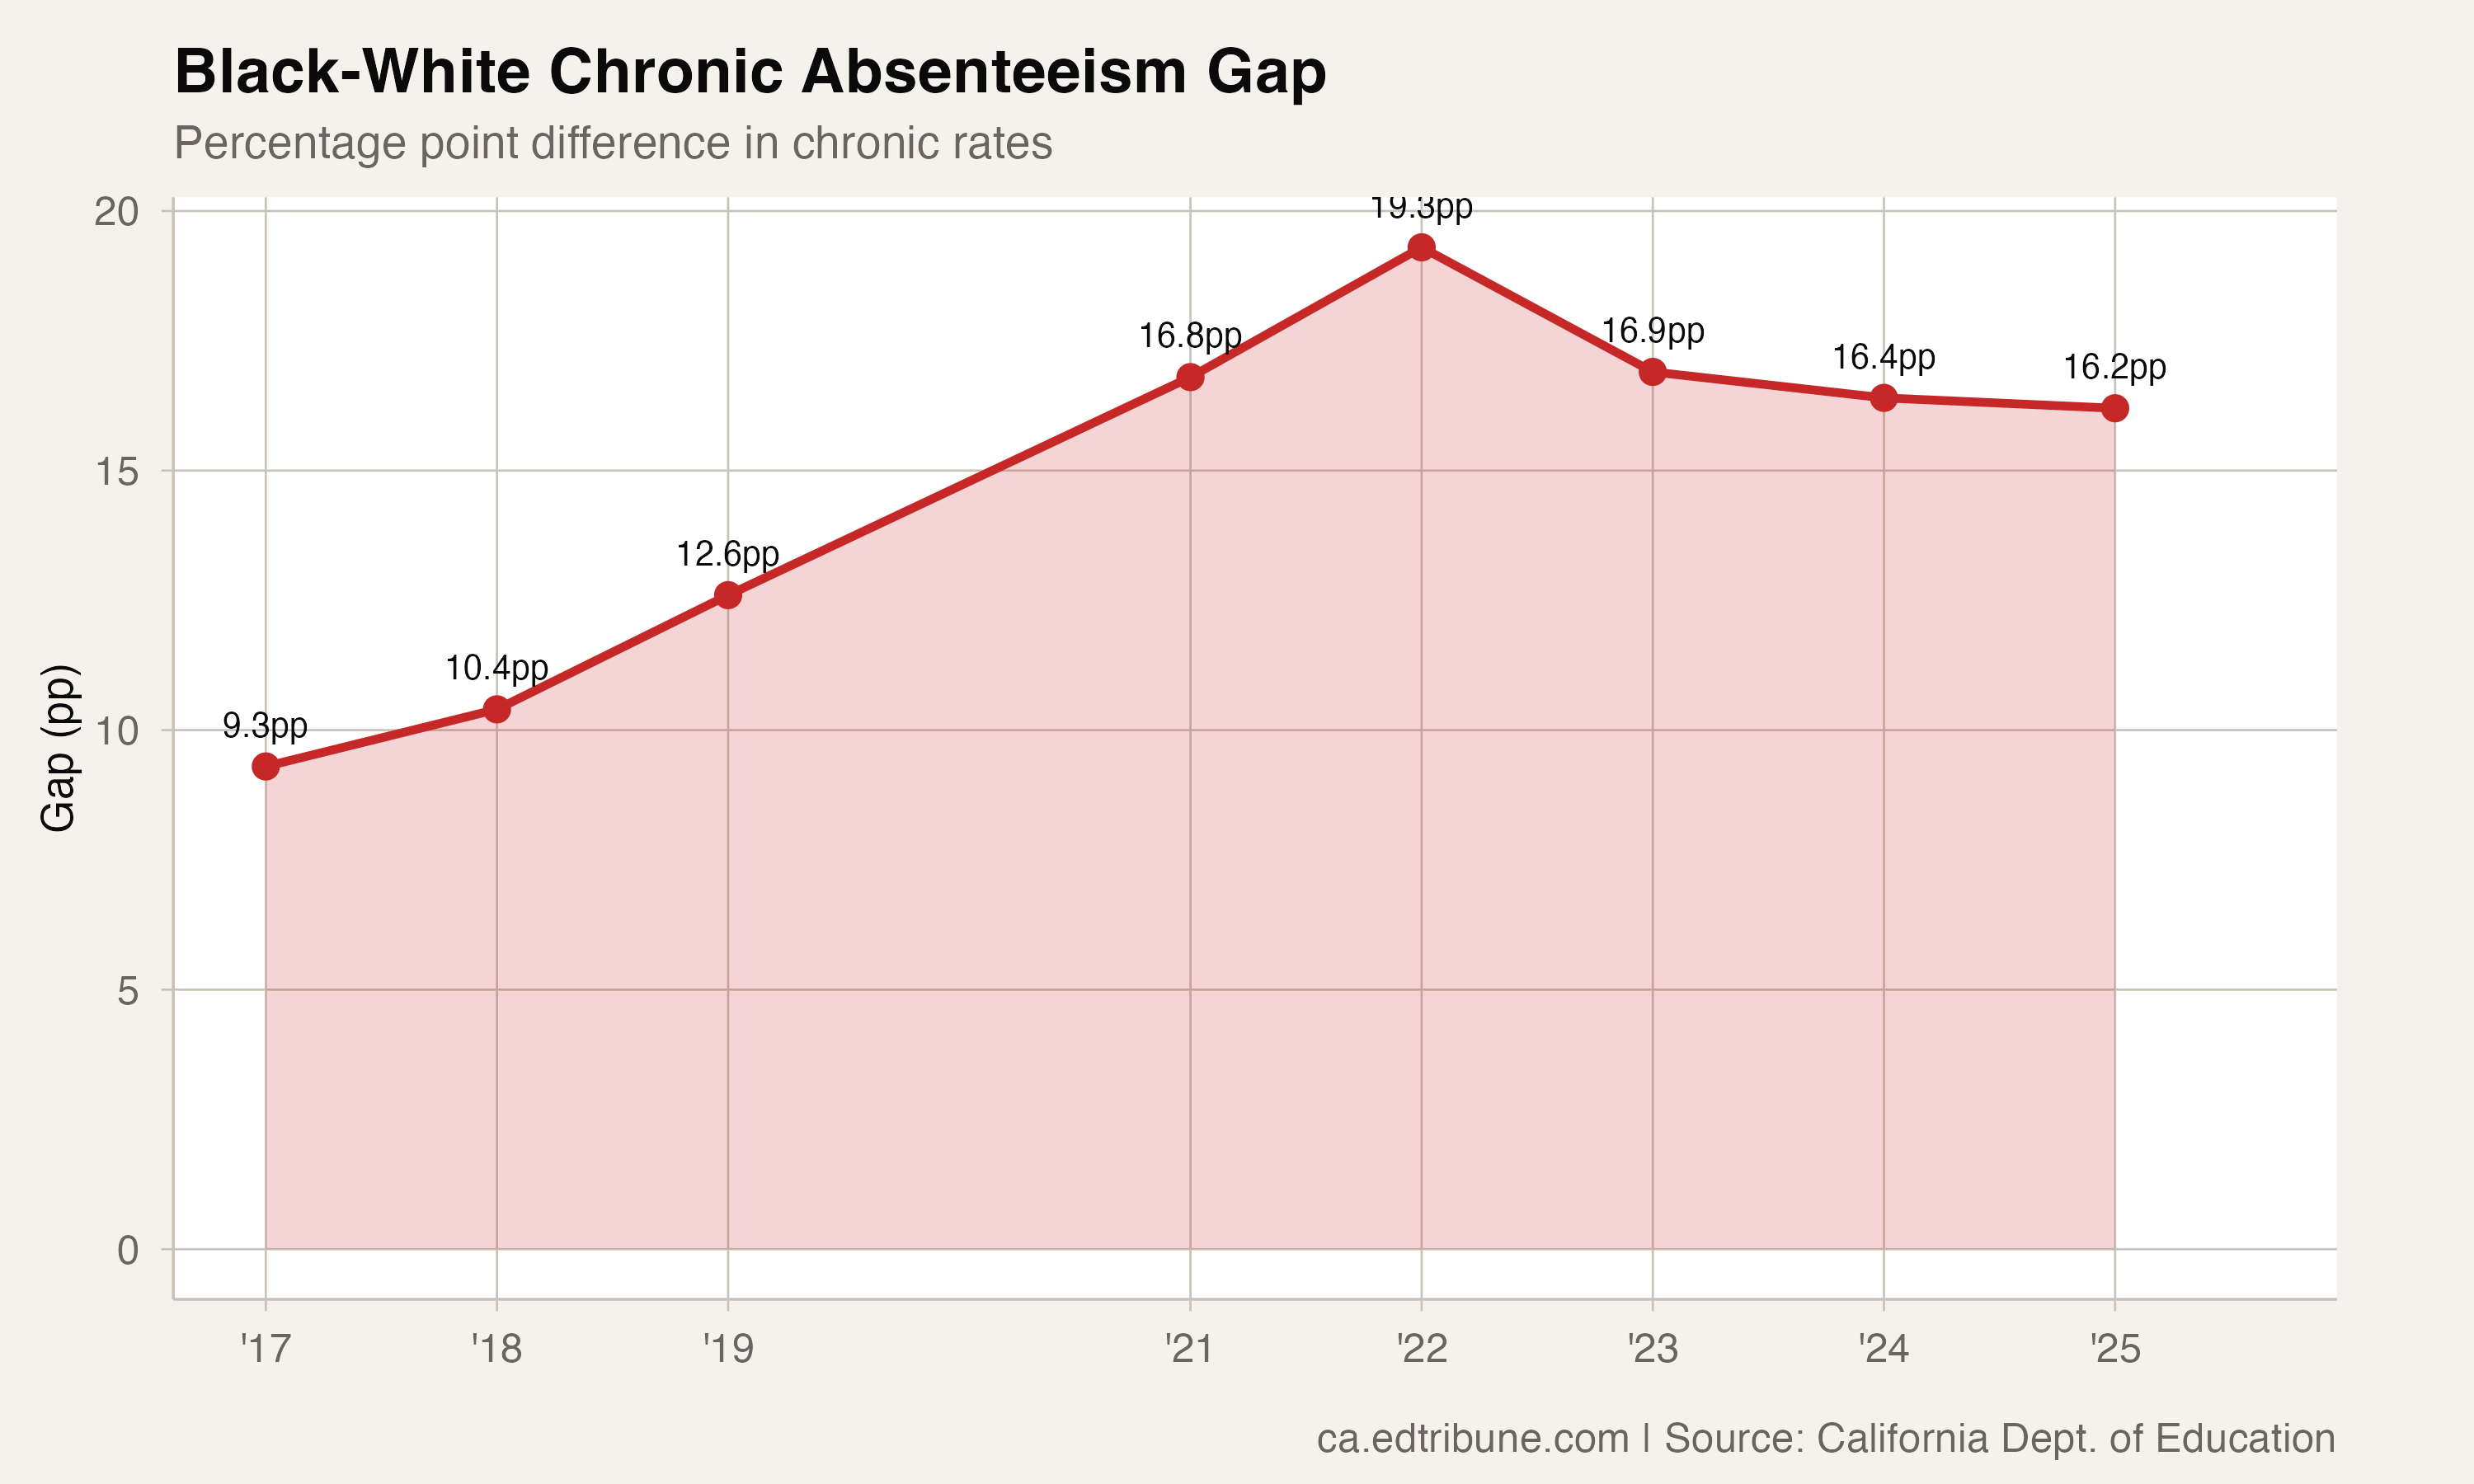
The gap widened across the earliest available years: 9.3 points in 2017, 10.4 in 2018, and 12.6 in 2019. It reached 19.3 points in 2022. At the latest point it was 16.2 points -- narrower than the peak but still 3.6 points wider than the earlier comparison.
Both groups' rates fell from the 2022 peak, but the gap remains wider than the earlier comparison. Black chronic absenteeism rose from 22.5% in 2019 to 42.5% at the peak before falling to 31.3% in 2025. White students went from 9.9% to 23.2% and then to 15.1%; both latest rates remained above their earlier values.
The arithmetic of returning to 2019 gaps
Returning to the 2019 gaps, from the 2025 rates, would require the Black rate to fall 3.6 percentage points more than the white rate, the Hispanic rate 3.7 points more, the multiracial rate 0.3 points more, the Native American rate 4.6 points more, and the Pacific Islander rate 5.9 points more. That is arithmetic from the measured gaps, not a forecast.
The statewide file does not identify why the gaps changed or evaluate interventions. It shows that all five above-white gaps remain wider than in 2019; the four larger gaps narrowed after their 2022 peaks.
Detailed code that reproduces the analysis and figures in this article is available exclusively to EdTribune subscribers.
Discussion
Sign in to join the discussion.
Loading comments...