Correction (September 30, 2026): An earlier version of this article reported most of Los Angeles Unified's figures on the state's authorizer total, which includes the independent charter schools LAUSD authorizes but does not run. In the schools LAUSD runs, the chronic absenteeism rate peaked at 40.3% in 2021-22, not 36.9%; it was 20.5% in 2018-19, not 18.4%, and 12.8% in 2017-18, not 11.9%. Rates by group are also higher: 37.4% for Black students (not 35.6%), 25.8% for Hispanic students (not 24.6%), 20.3% for white students (not 18.3%), 10.6% for Asian students (not 10.1%) and 27.2% for students from low-income families (not 26.1%), and the Black-Asian gap is 26.8 points, not 25.5. LAUSD-run schools account for 8.5% of the state's chronically absent students, not about 11%. The earlier version also compared LAUSD with enrollment figures, a school count and a national ranking that were not drawn from the state's data, and described statements by the superintendent and district investments without a source; those passages were removed. The headline, charts and text have been updated.
The schools that Los Angeles Unified↗ET runs enrolled 381,399 students in 2024-25, the most recent year in the state's published data. Of those, 96,925, or 25.4%, were chronically absent, missing at least 10% of the days they were enrolled.
That is 14.9 points below the 40.3% peak of 2021-22. It is also nearly as many students as San Diego Unified↗ET, the state's second-largest district, enrolls in all the schools it runs (98,281), and more than Fresno Unified↗ET, the third largest, enrolls (70,126).
LAUSD also authorizes independent charter schools that it does not run. The state reports a combined figure for the district and those charters: 528,612 students, of whom 126,481 (23.9%) were chronically absent. The authorized charters on their own, with 150,527 students, posted a lower rate of 20.7%, which is why the combined figure sits below the rate in LAUSD's own schools. The rest of this article uses the schools LAUSD runs.
Most of the way down from the peak
The rate in LAUSD's schools fell each year after 2021-22: to 32.8%, then 26.4%, then 25.4%. The last step was the smallest. The district's iAttend program uses home visits, automated phone calls and case management for students who are chronically absent; the state's data can show the rate falling but not which efforts moved it.
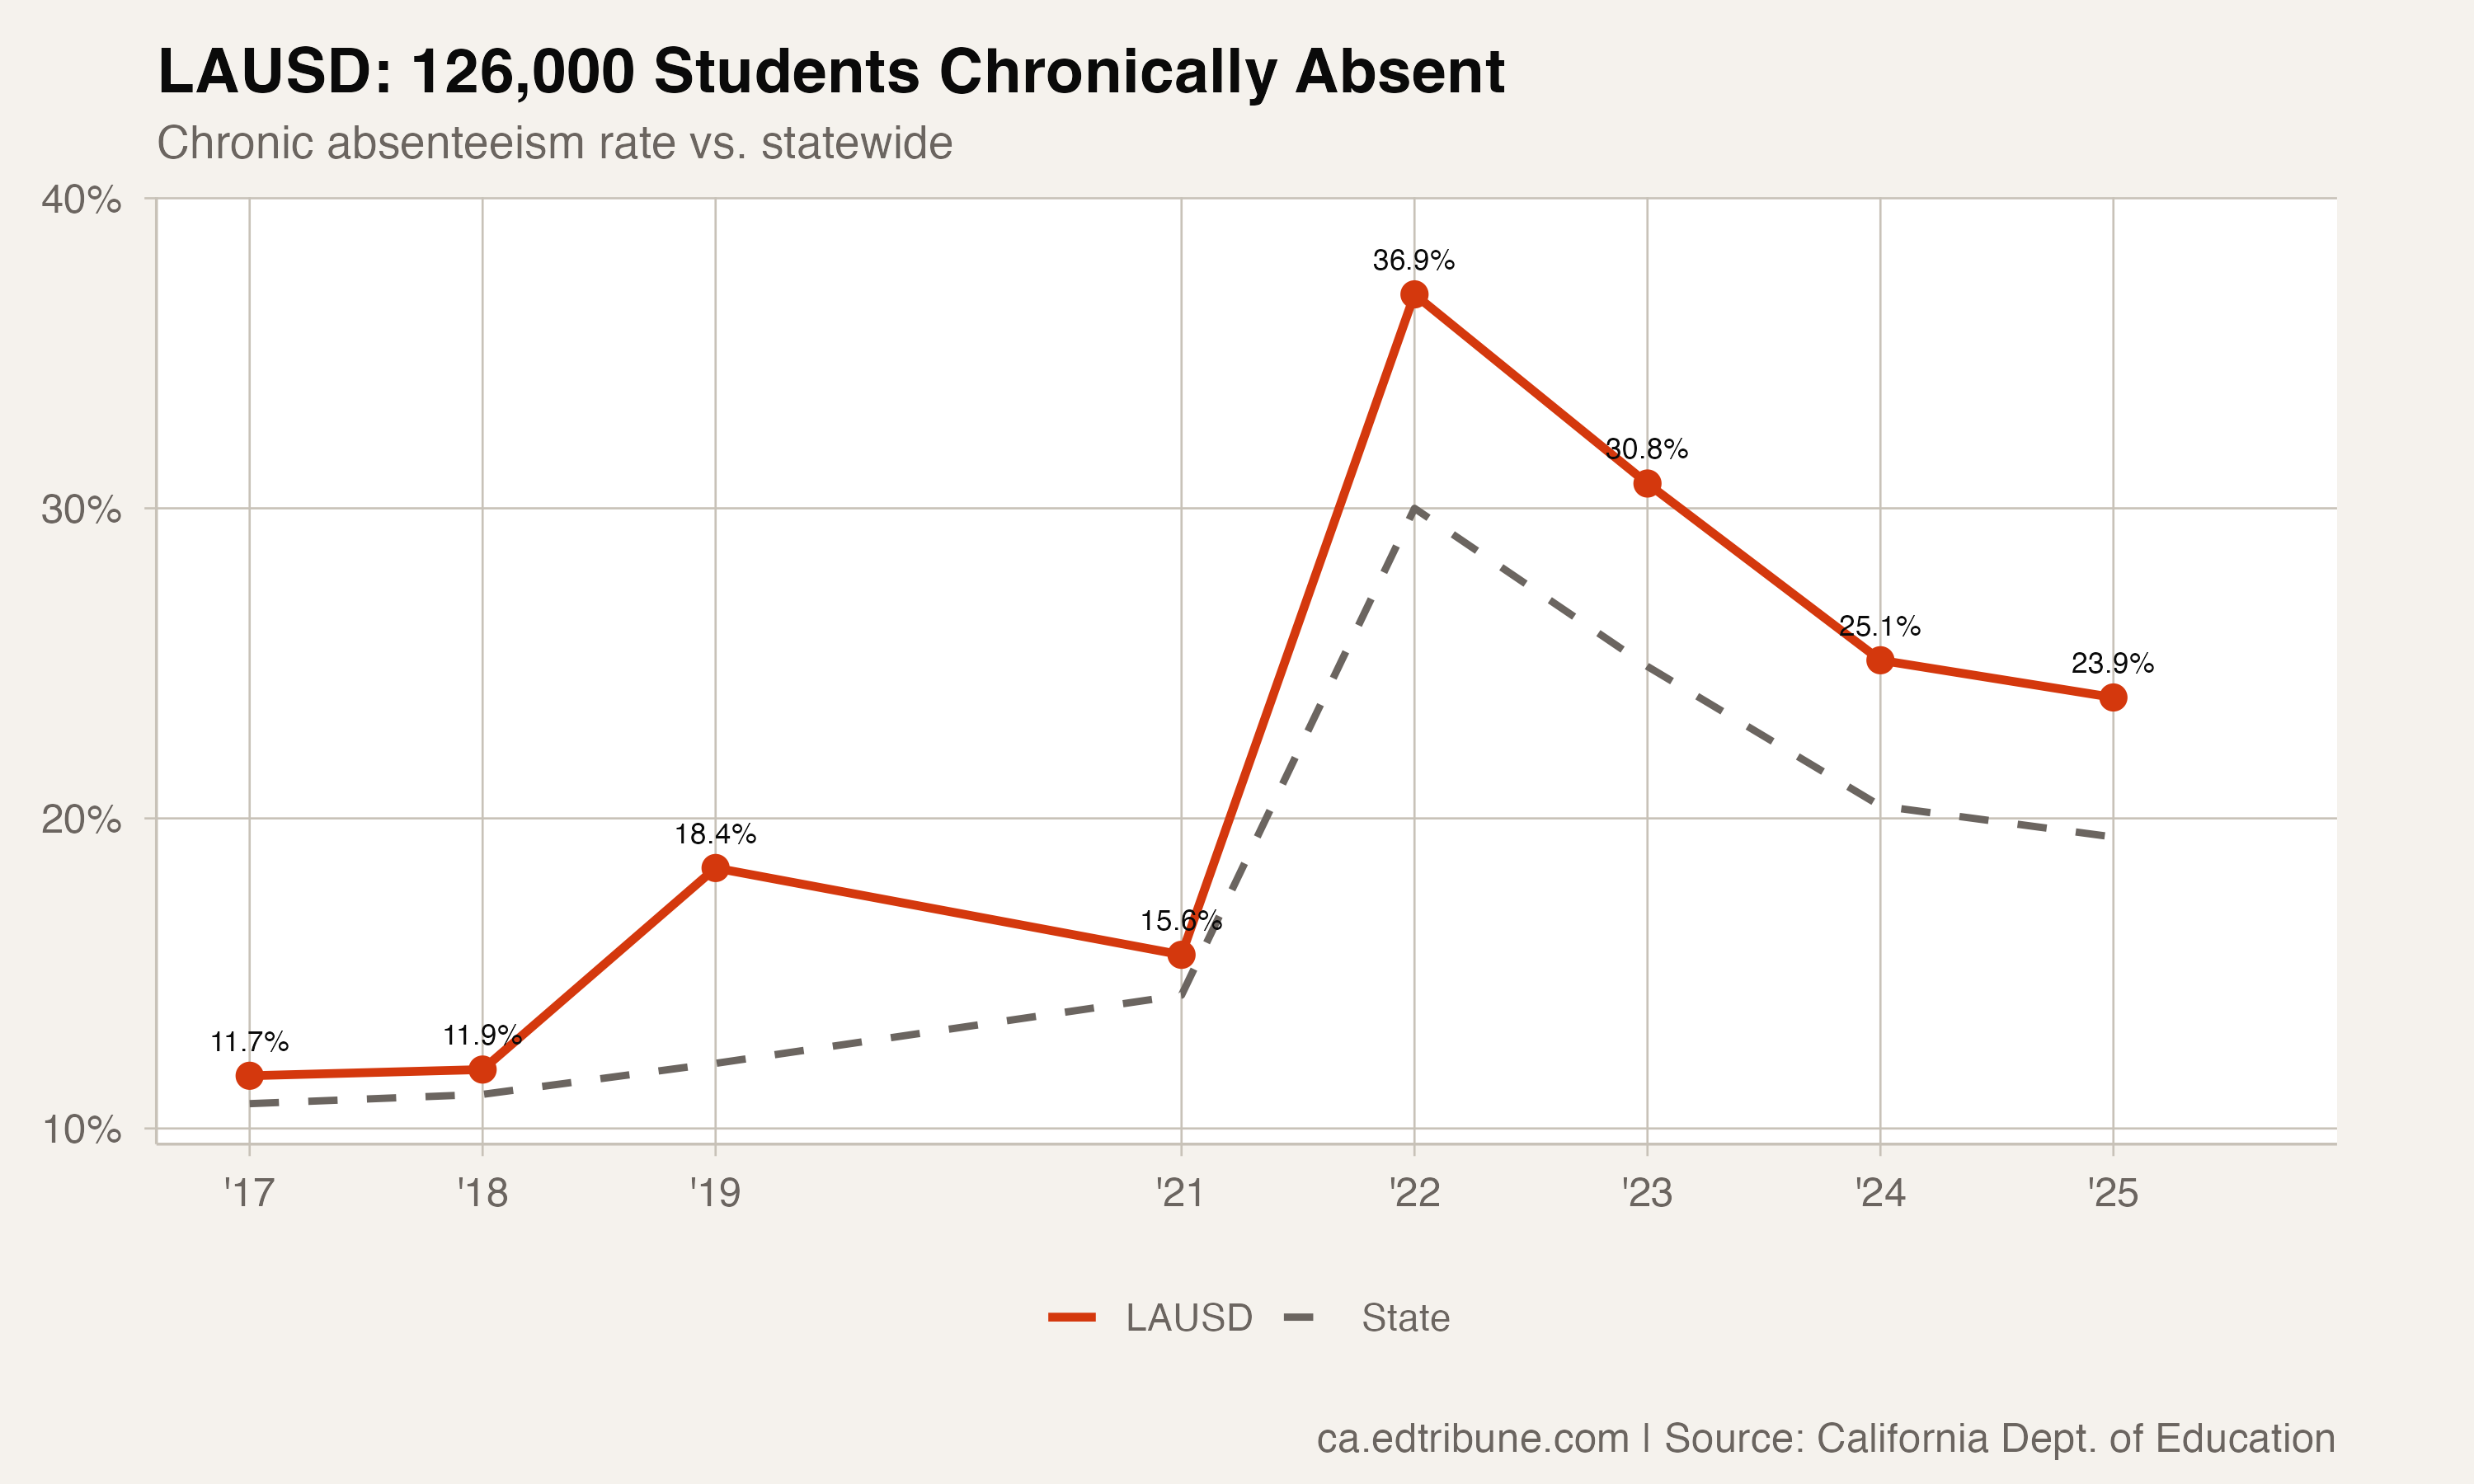
The 2024-25 rate is still 4.9 points above the 20.5% LAUSD's schools posted in 2018-19, the last full year before the pandemic. That baseline itself was a jump: the rate was 12.8% in 2017-18, so it rose 7.7 points in a single year before COVID closed schools. The published data do not explain that increase. Measured against 2017-18 instead, LAUSD's schools are 12.6 points above their earlier level.
The divide inside LAUSD
Within the district's own schools, chronic absenteeism varies widely by student group.
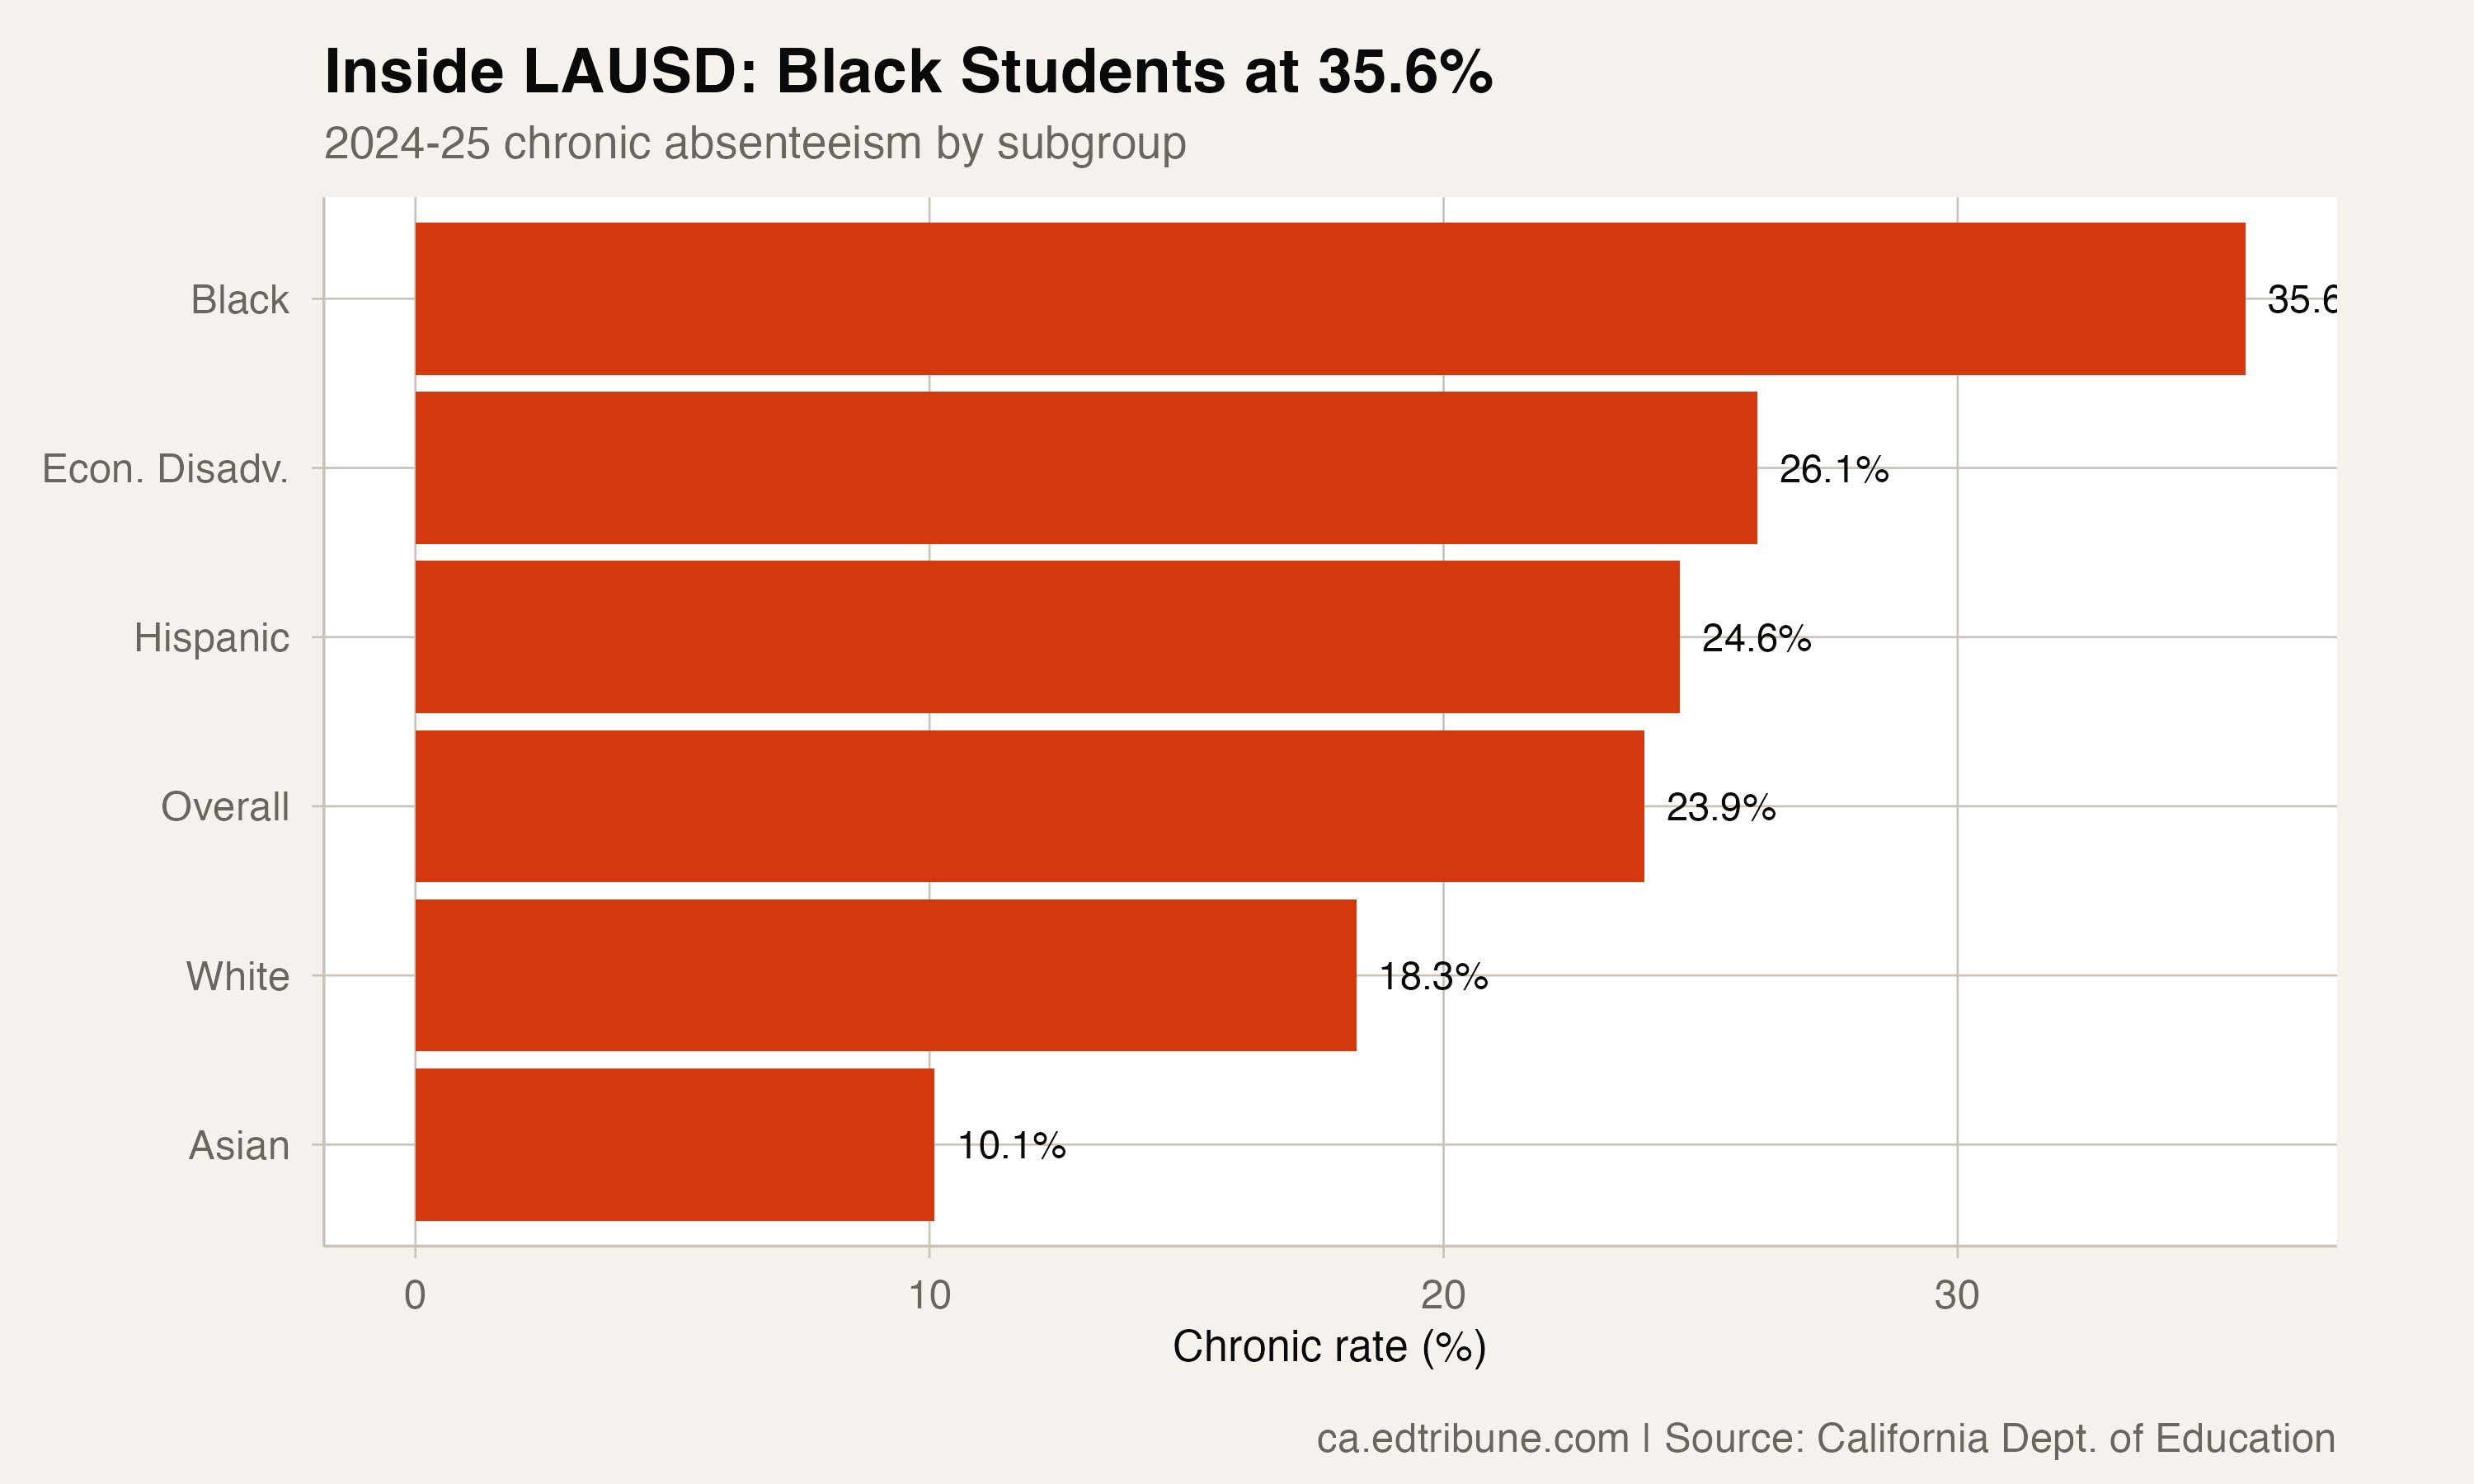
In 2024-25, 37.4% of Black students were chronically absent, 10,586 students. The rate was 25.8% for Hispanic students (74,577), 20.3% for white students (5,910) and 10.6% for Asian students (1,237). Among students from low-income families, 27.2% were chronically absent, 89,791 students.
The 26.8-point gap between Black and Asian students is inside a single district, with the same calendar, the same attendance rules and the same central office. It shows how sharply chronic absenteeism concentrates by group even within one system.
The count in context
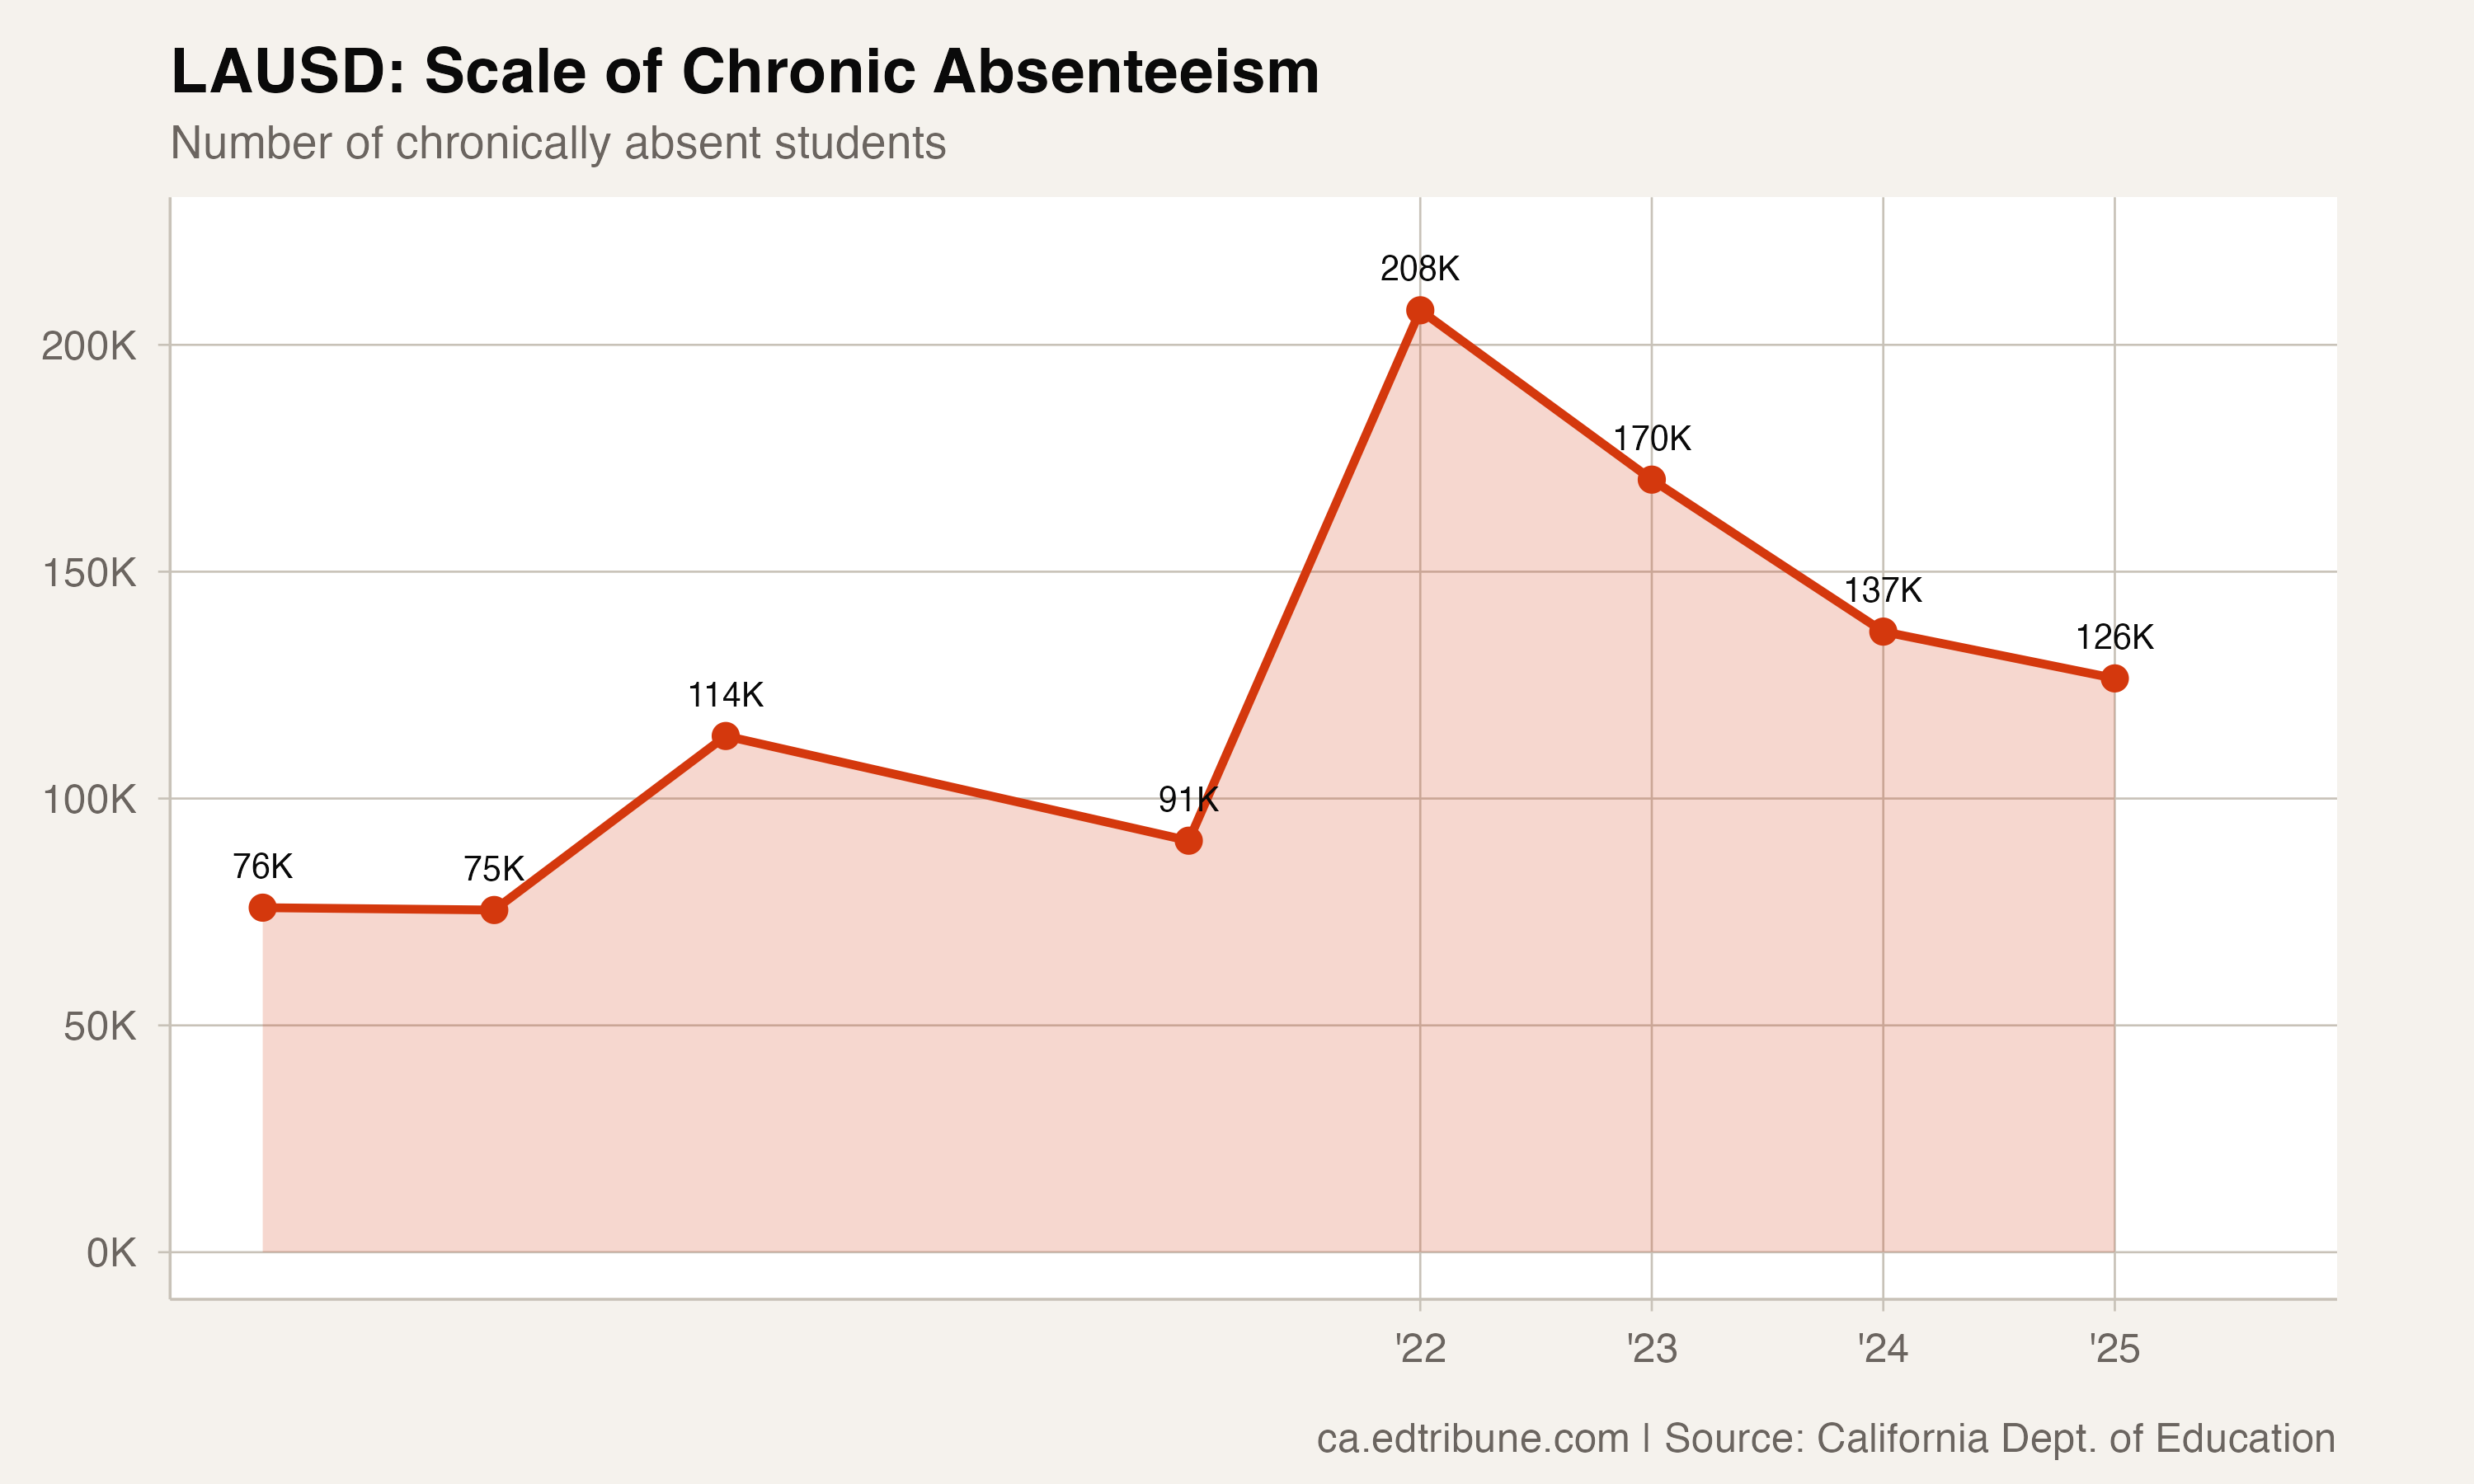
The number of chronically absent students in LAUSD's schools peaked at 165,895 in 2021-22 and has fallen by 68,970 since. That is real progress. The 2024-25 count is still above the 95,353 of 2018-19 and well above the 61,072 of 2017-18.
What LAUSD means for California
LAUSD's own schools account for 8.5% of the 1,143,668 chronically absent students in California's public schools. A statewide improvement that bypasses Los Angeles will be hard to see in the state average. At LAUSD's 2024-25 enrollment, every 5 points off its rate would mean roughly 19,000 more students attending regularly.
The district has shown it can bring the rate down quickly. The last year's smaller step, and a rate still above where it stood before the pandemic, are what the next school year will be measured against.
Detailed code that reproduces the analysis and figures in this article is available exclusively to EdTribune subscribers.
Discussion
Sign in to join the discussion.
Loading comments...