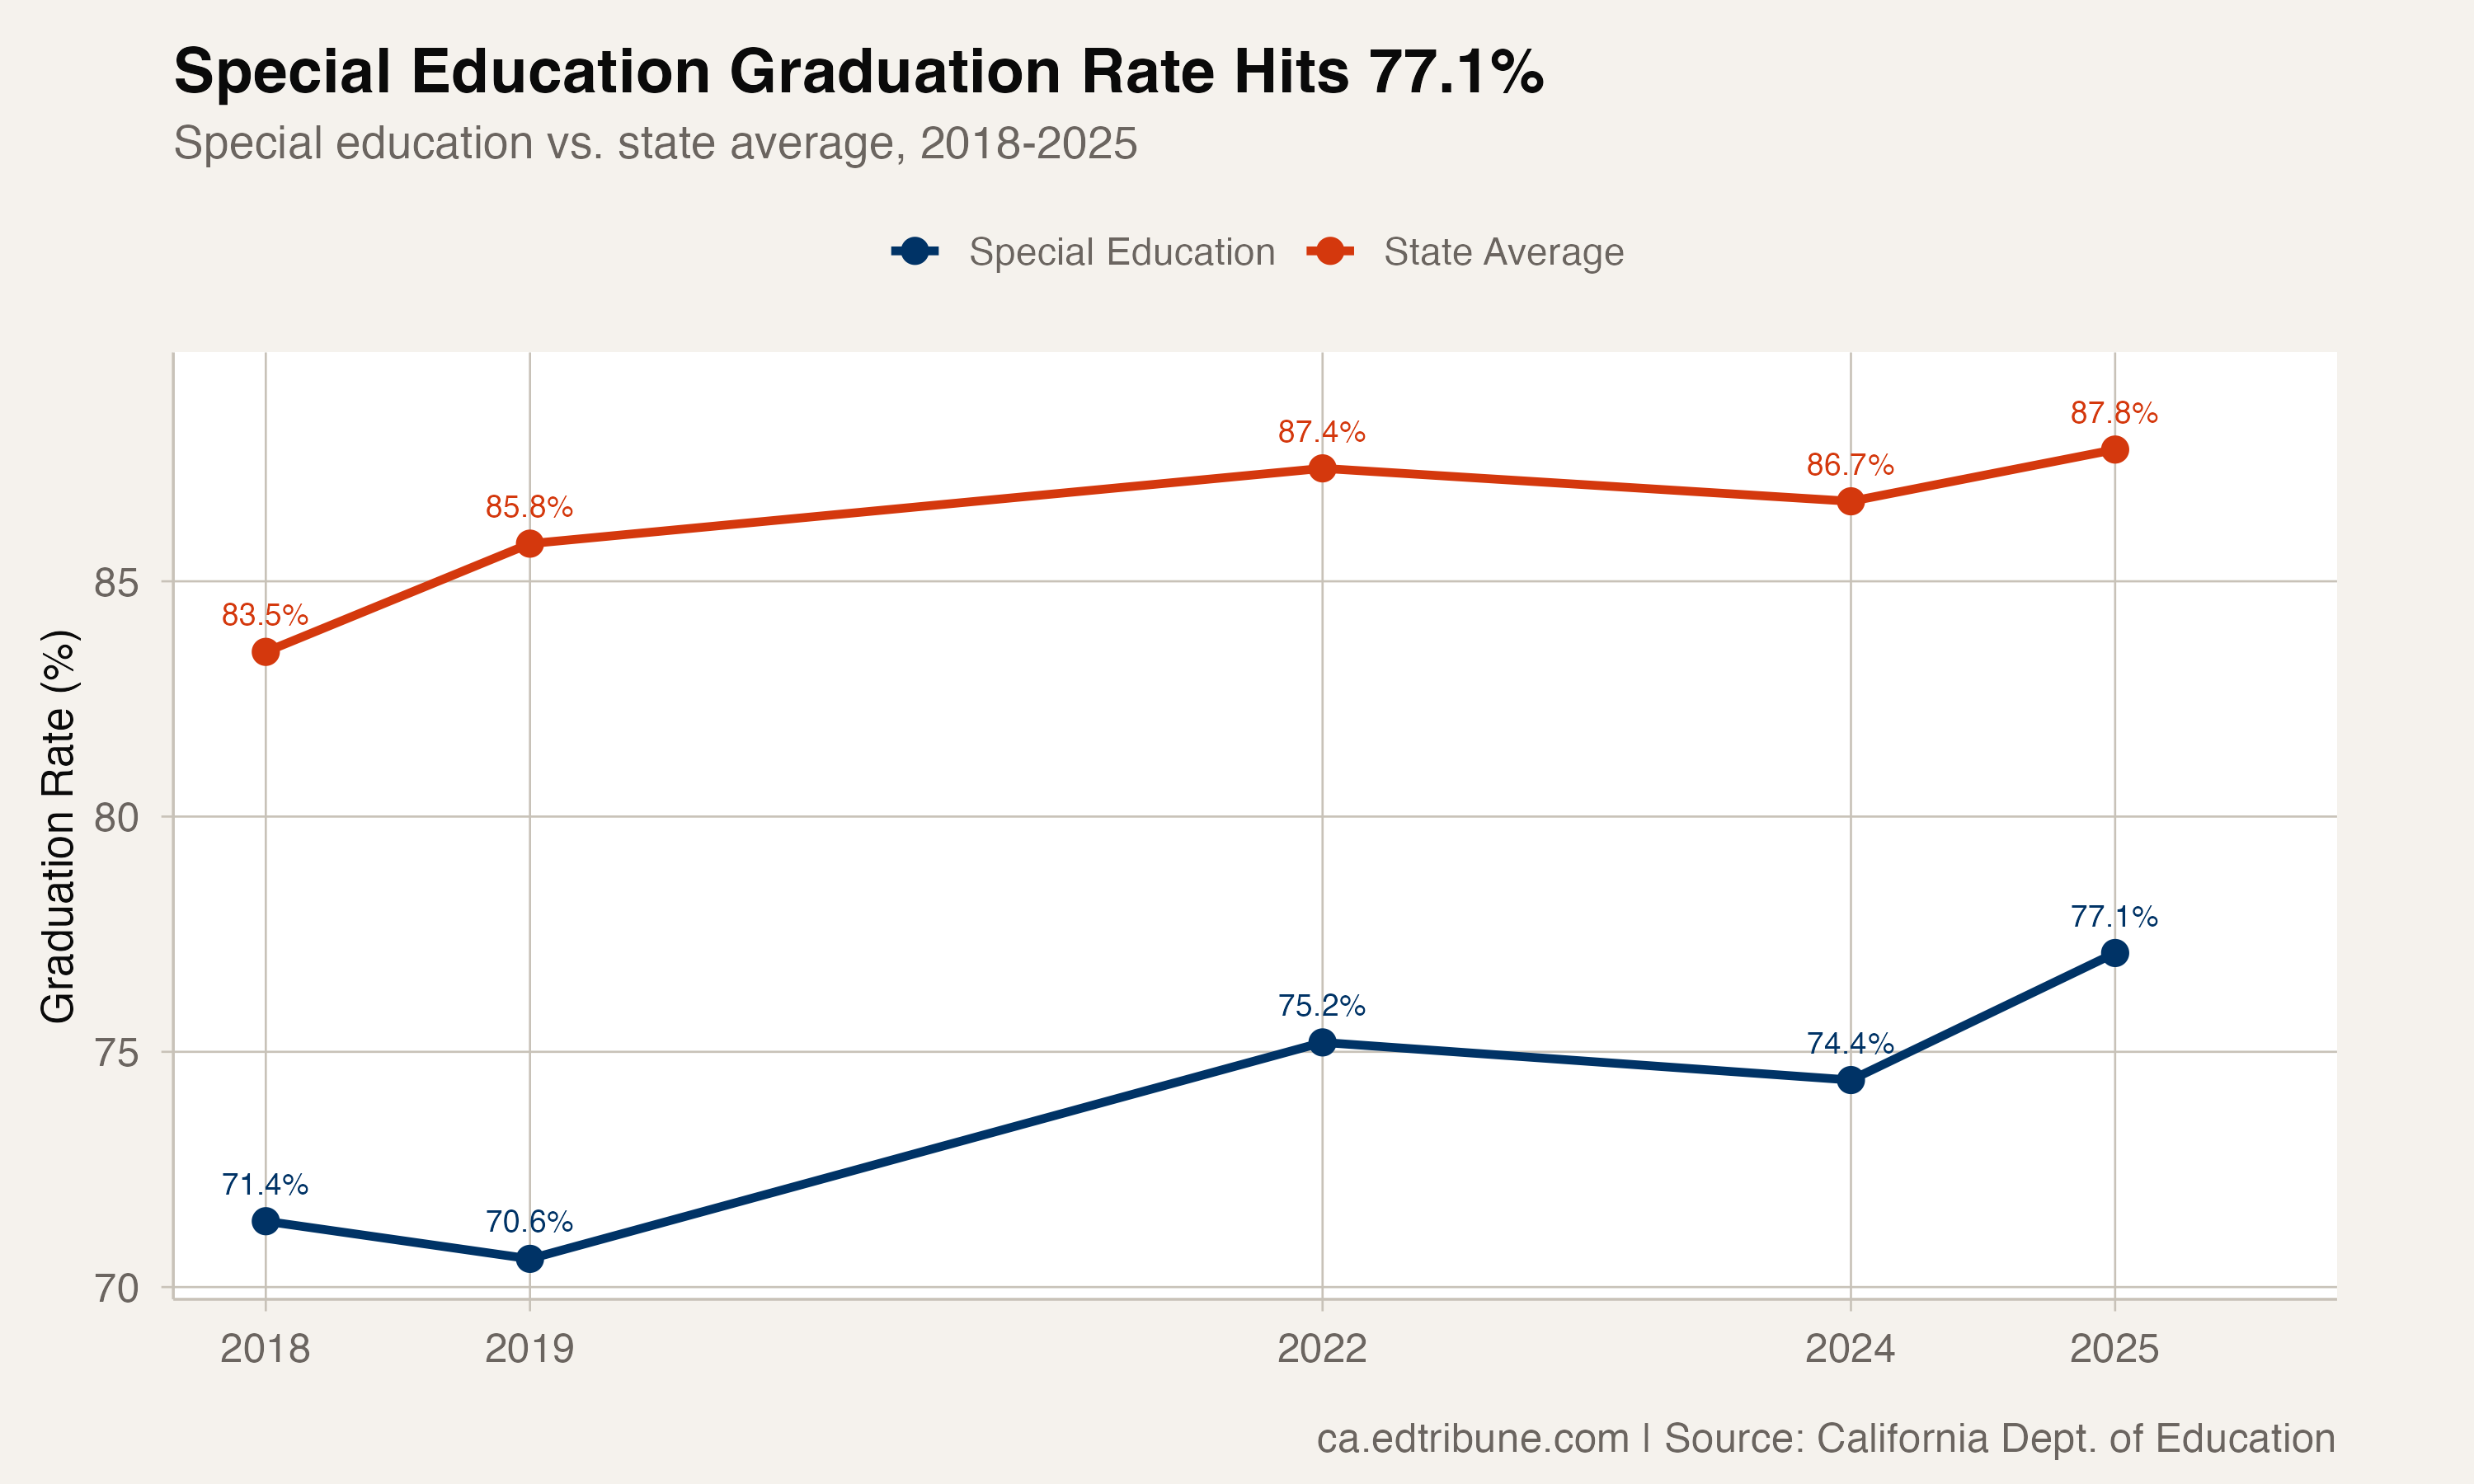
California's special education students graduated at 77.1% in 2025, the highest rate in the five graduation years currently available in the state data files. That is a 5.7-point improvement from 71.4% in 2018.
The problem is that the state average has risen too. The gap between special education students and the overall rate was 12.1 points in 2018, ballooned to 15.2 points in 2019 as general education gains outpaced special ed, then gradually compressed back to 10.7 points by 2025. The net closure of 1.4 points over seven years masks a rougher journey than a straight line would suggest.
The Stubborn Gap
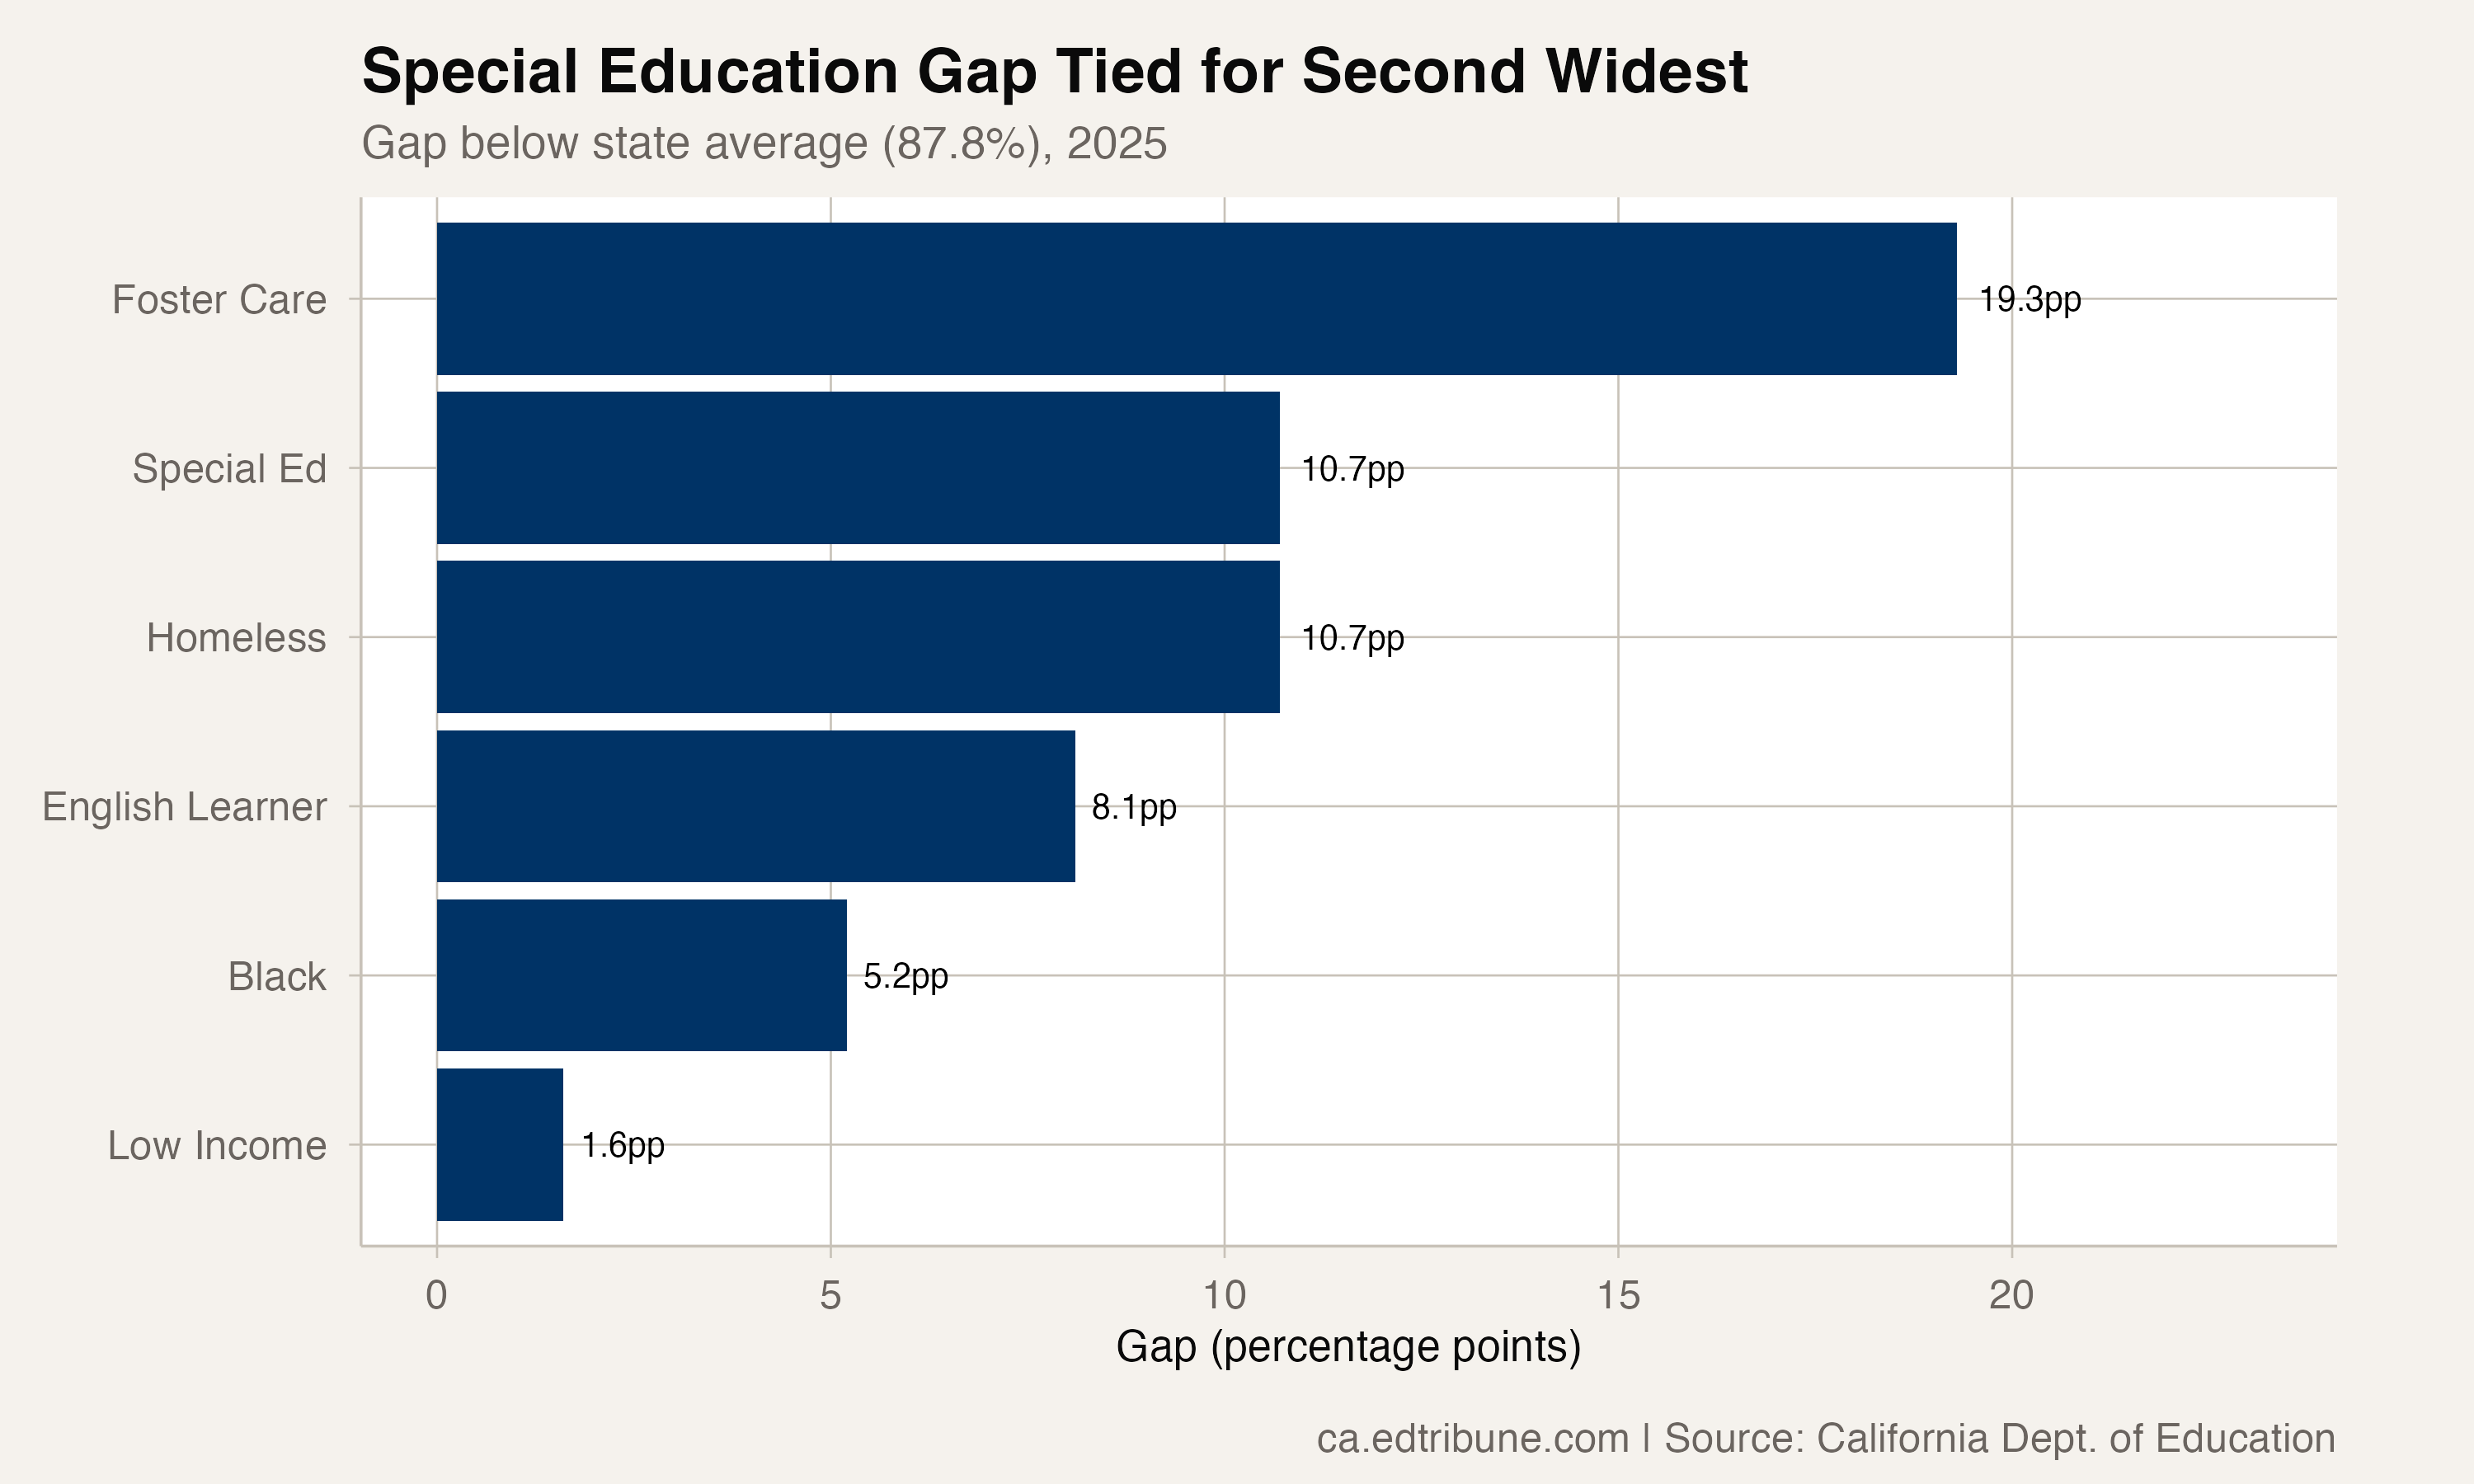
The special education gap has proven more resistant to closure than several other major gaps in California's graduation data. Over the same period, the white-Black gap closed by 9.2 points, the foster care gap closed by 5.2 points, and the English learner gap closed by 4.5 points. The homeless gap widened by 3.2 points. The special education gap moved just 1.4 points.
The data files do not say why the gap is so durable. They show the outcome, not the mix of instructional settings, disability categories, course-taking patterns, transition services, or local graduation pathways behind it. The verified pattern is narrower and more useful: even when the special education rate rises, the state average often rises too, so parity requires faster gains than California has produced so far.
The Scale
California's special education graduation cohort is 71,373 students, representing 14.1% of the total. At 77.1%, 16,329 did not graduate. The 2025 cohort is larger than the total enrollment of most California school districts.
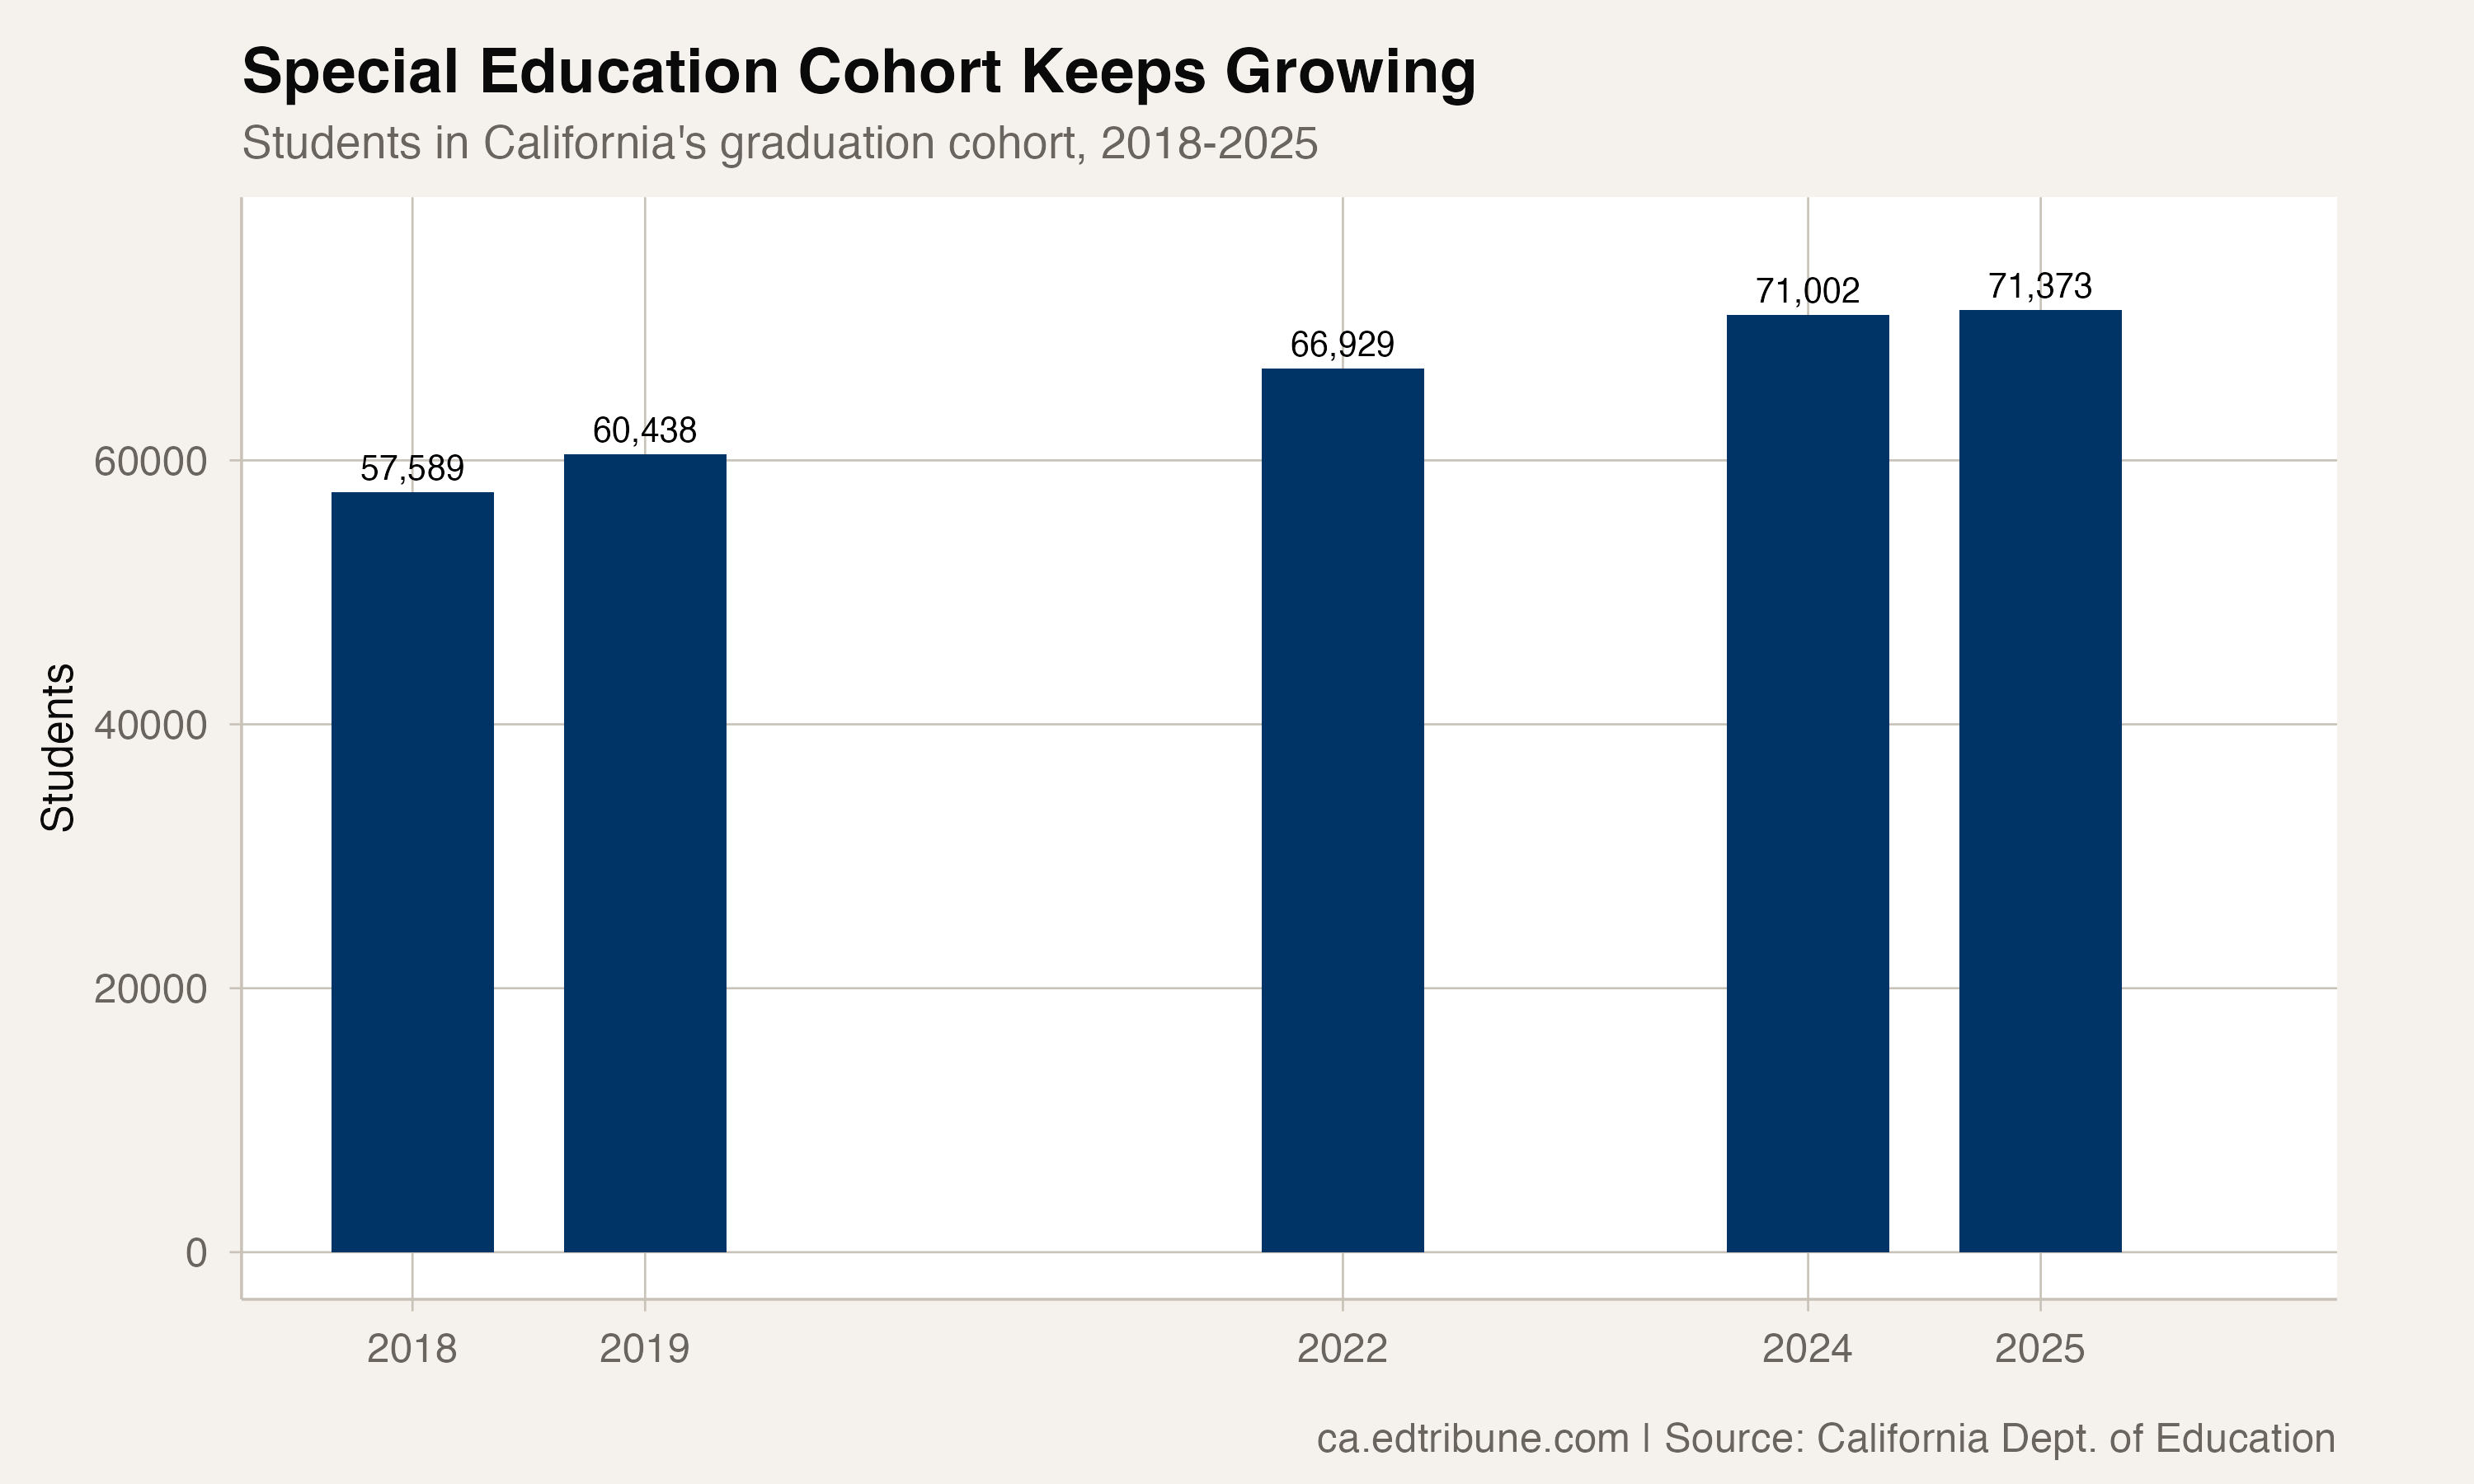
The cohort has been growing: from 57,589 in 2018 to 71,373 in 2025, an increase of 23.9%. That makes rate improvement harder to interpret as a student-count outcome. The share graduating improved, but the number of students outside the graduating group barely changed: 16,329 in 2025, compared with 16,467 in 2018.
Los Angeles Unified alone had 4,398 students in the 2025 special education graduation cohort, more than three times Kern High's 1,357 and more than four times Antelope Valley Union High's 957. LAUSD's 77.8% rate was close to the statewide special education rate, but its scale still left 976 students in the cohort who did not graduate, the largest district-level count in the state file.
The Second-Widest Gap
In 2025, the special education gap of 10.7 points is tied for the second-widest in California's graduation data, behind only foster care at 19.3 points. It matches the gap for students who were homeless.
What distinguishes the special education gap is its apparent resistance to improvement. The state has produced a higher special education graduation rate, but not enough relative progress to close the distance quickly. At the 2018-to-2025 pace, eliminating a 10.7-point gap would take more than five decades.
The Path Ahead
The 2022 data offers a cautionary note. After reaching 75.2% that year, the special education rate dropped to 74.4% in 2024 before rebounding to 77.1% in 2025. The available data cannot isolate the cause of that dip, but it does show that recent gains have not been linear.
The 10.7-point gap is not a forecast. It is a benchmark. The next data release will show whether 2025 was a new level for the special education graduation rate or a rebound year inside the same long-running gap.
Detailed code that reproduces the analysis and figures in this article is available exclusively to EdTribune subscribers.
Discussion
Sign in to join the discussion.
Loading comments...