Correction: This article originally stated 147 districts exceeded 95% and that the foster care gap was more than four times the white-Black gap. The correct figures are 141 districts and approximately three times.
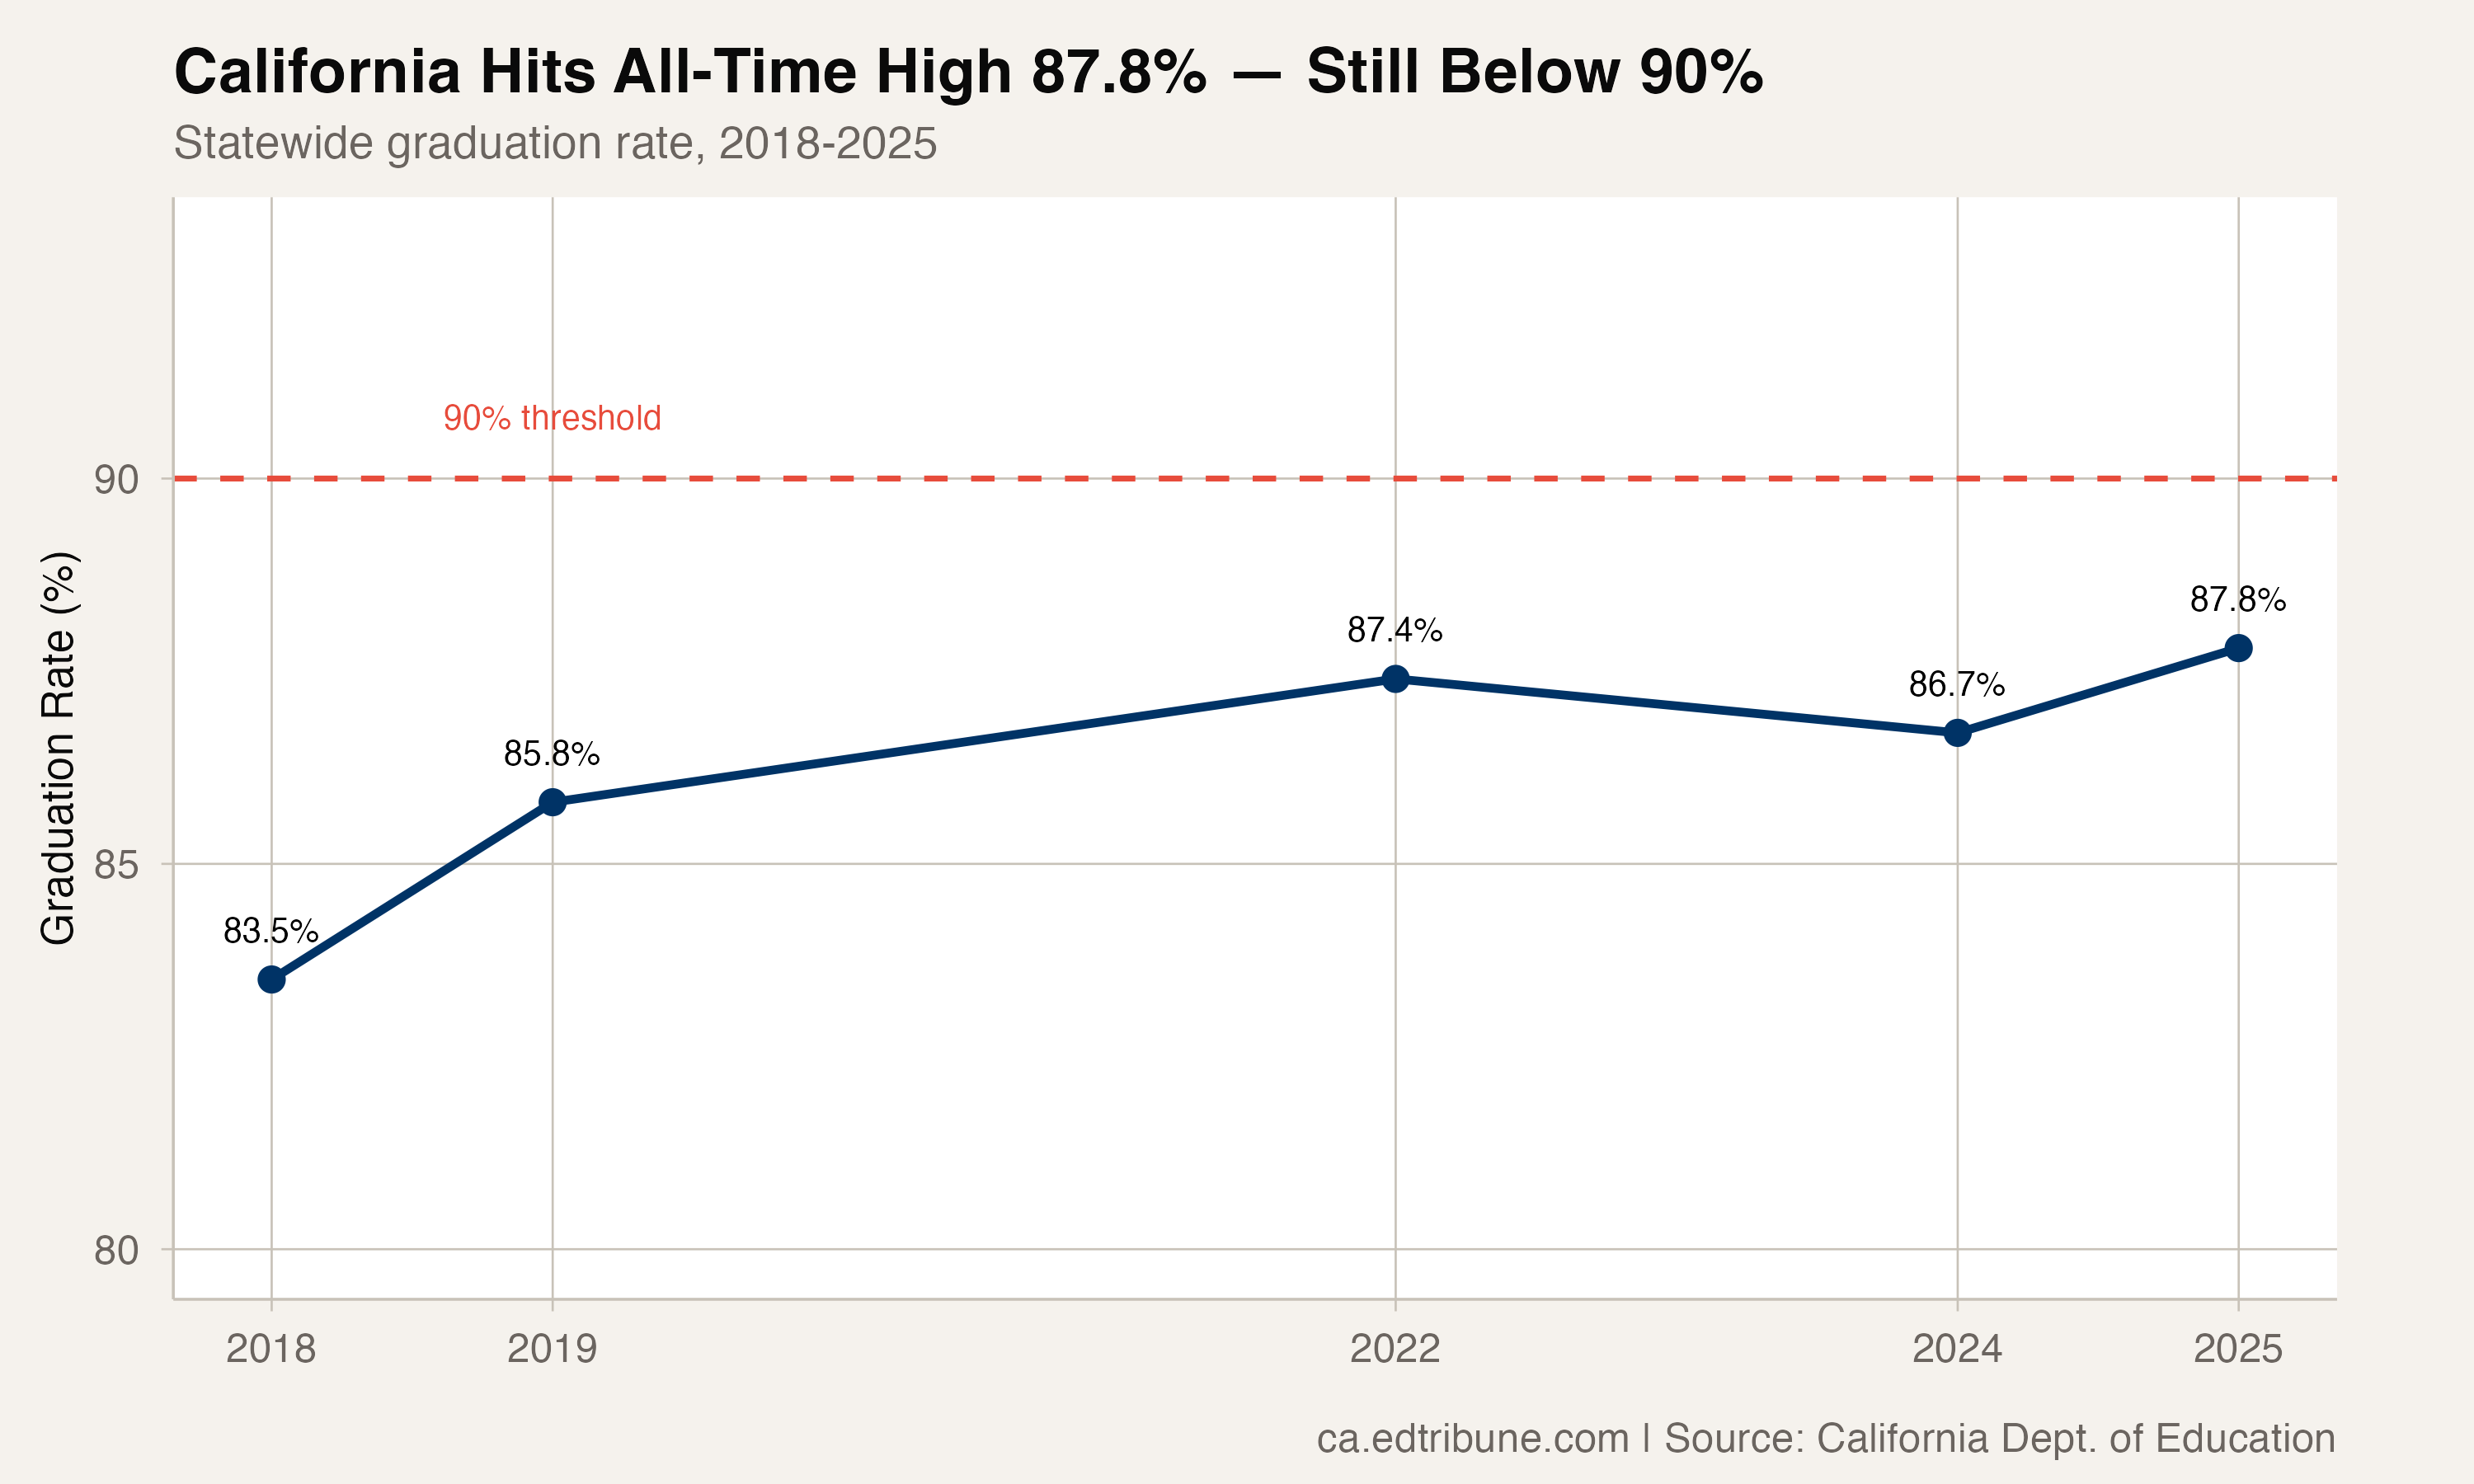
California graduated 87.8% of its students in 2025, the highest rate in the state's available data. It is the culmination of a seven-year climb from 83.5% in 2018 -- a gain of 4.3 percentage points that has been broad-based, touching nearly every subgroup and most districts.
And yet the number carries a quiet asterisk. California, the nation's largest state school system with more than half a million students in each graduation cohort, has never reached 90%.
The Arc
The state's trajectory has not been a straight line. The rate jumped 2.3 points between 2018 and 2019, continued rising through the COVID-era waiver years to 87.4% in 2022, then dipped to 86.7% in 2024 before rebounding to 87.8% in 2025. The 2024 dip -- California's only year-over-year decline in the data -- makes the 2025 recovery look more like a return to trend than a breakout.
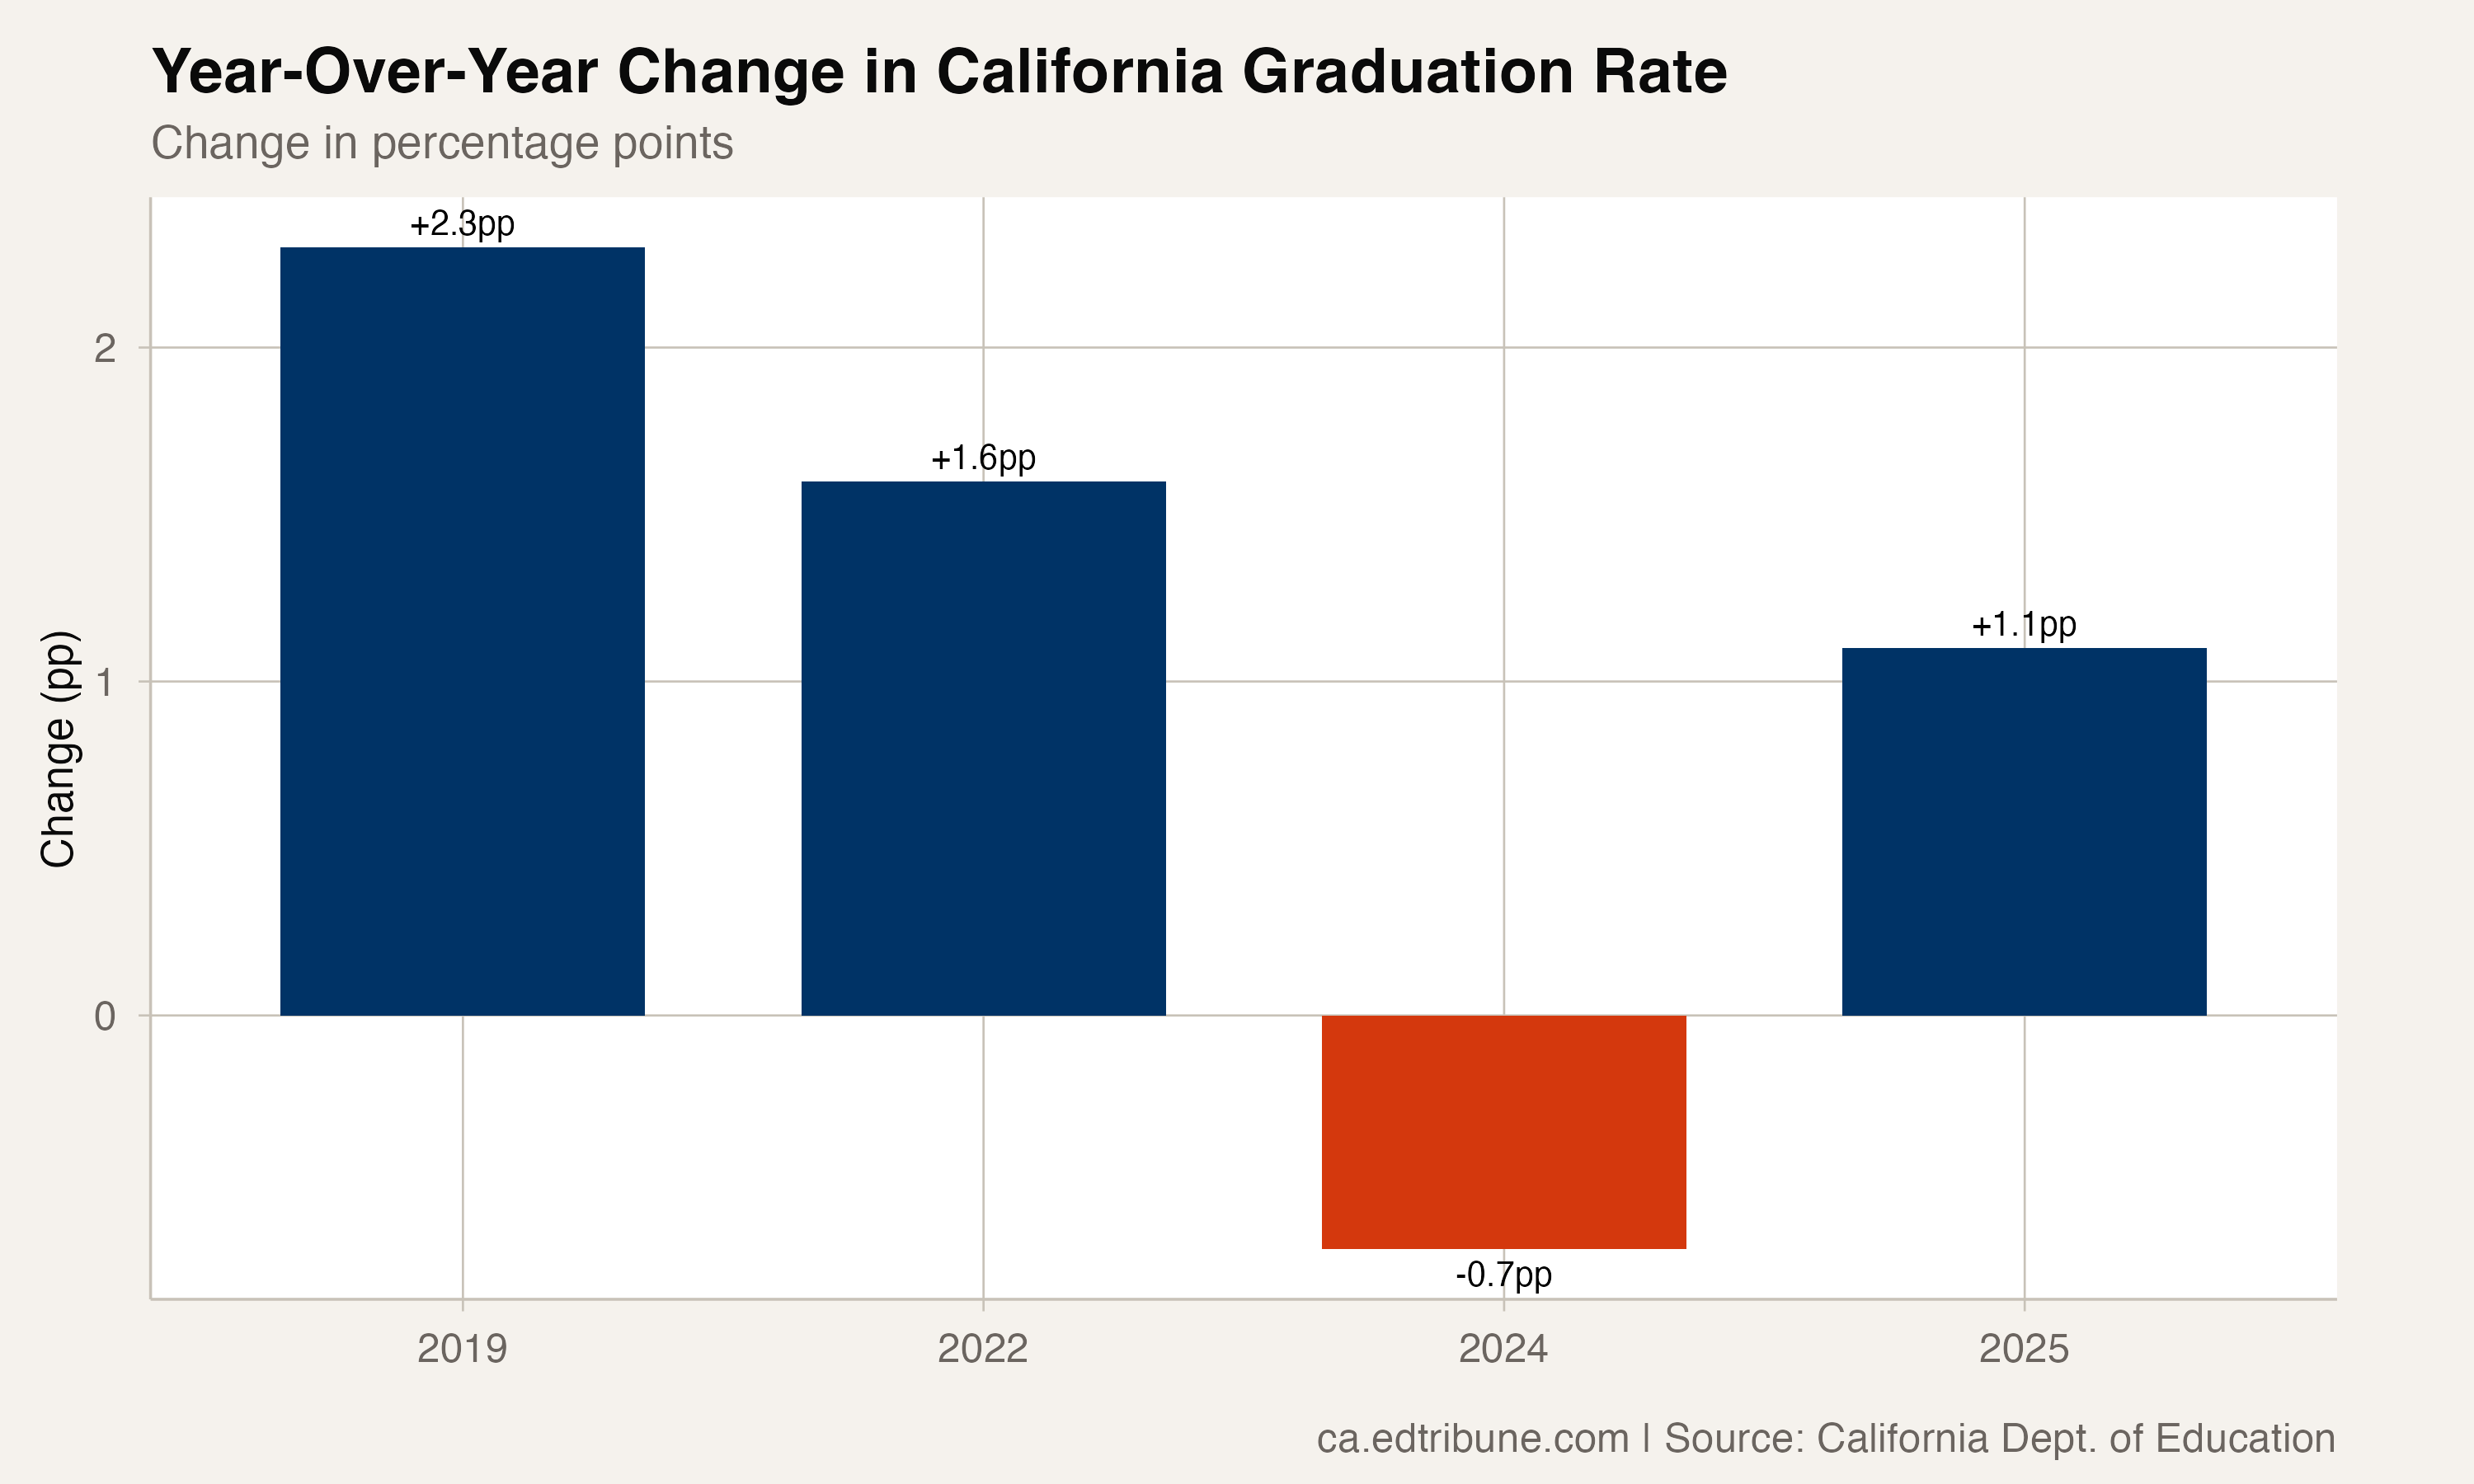
The improvement was widespread. In the most recent year, 304 of 440 districts with data in both years -- 69% -- improved their graduation rates. That kind of breadth suggests structural change rather than a few outlier districts pulling up the average.
Who Graduates
Filipino students lead the state at 95.4%, followed by Asian students at 92.6% and white students at 89.0%. Hispanic students, who constitute 56.6% of the cohort at 287,352 students, graduate at 86.9% -- within 2.1 points of white students. Black students are at 82.6%, up from 72.1% in 2018.
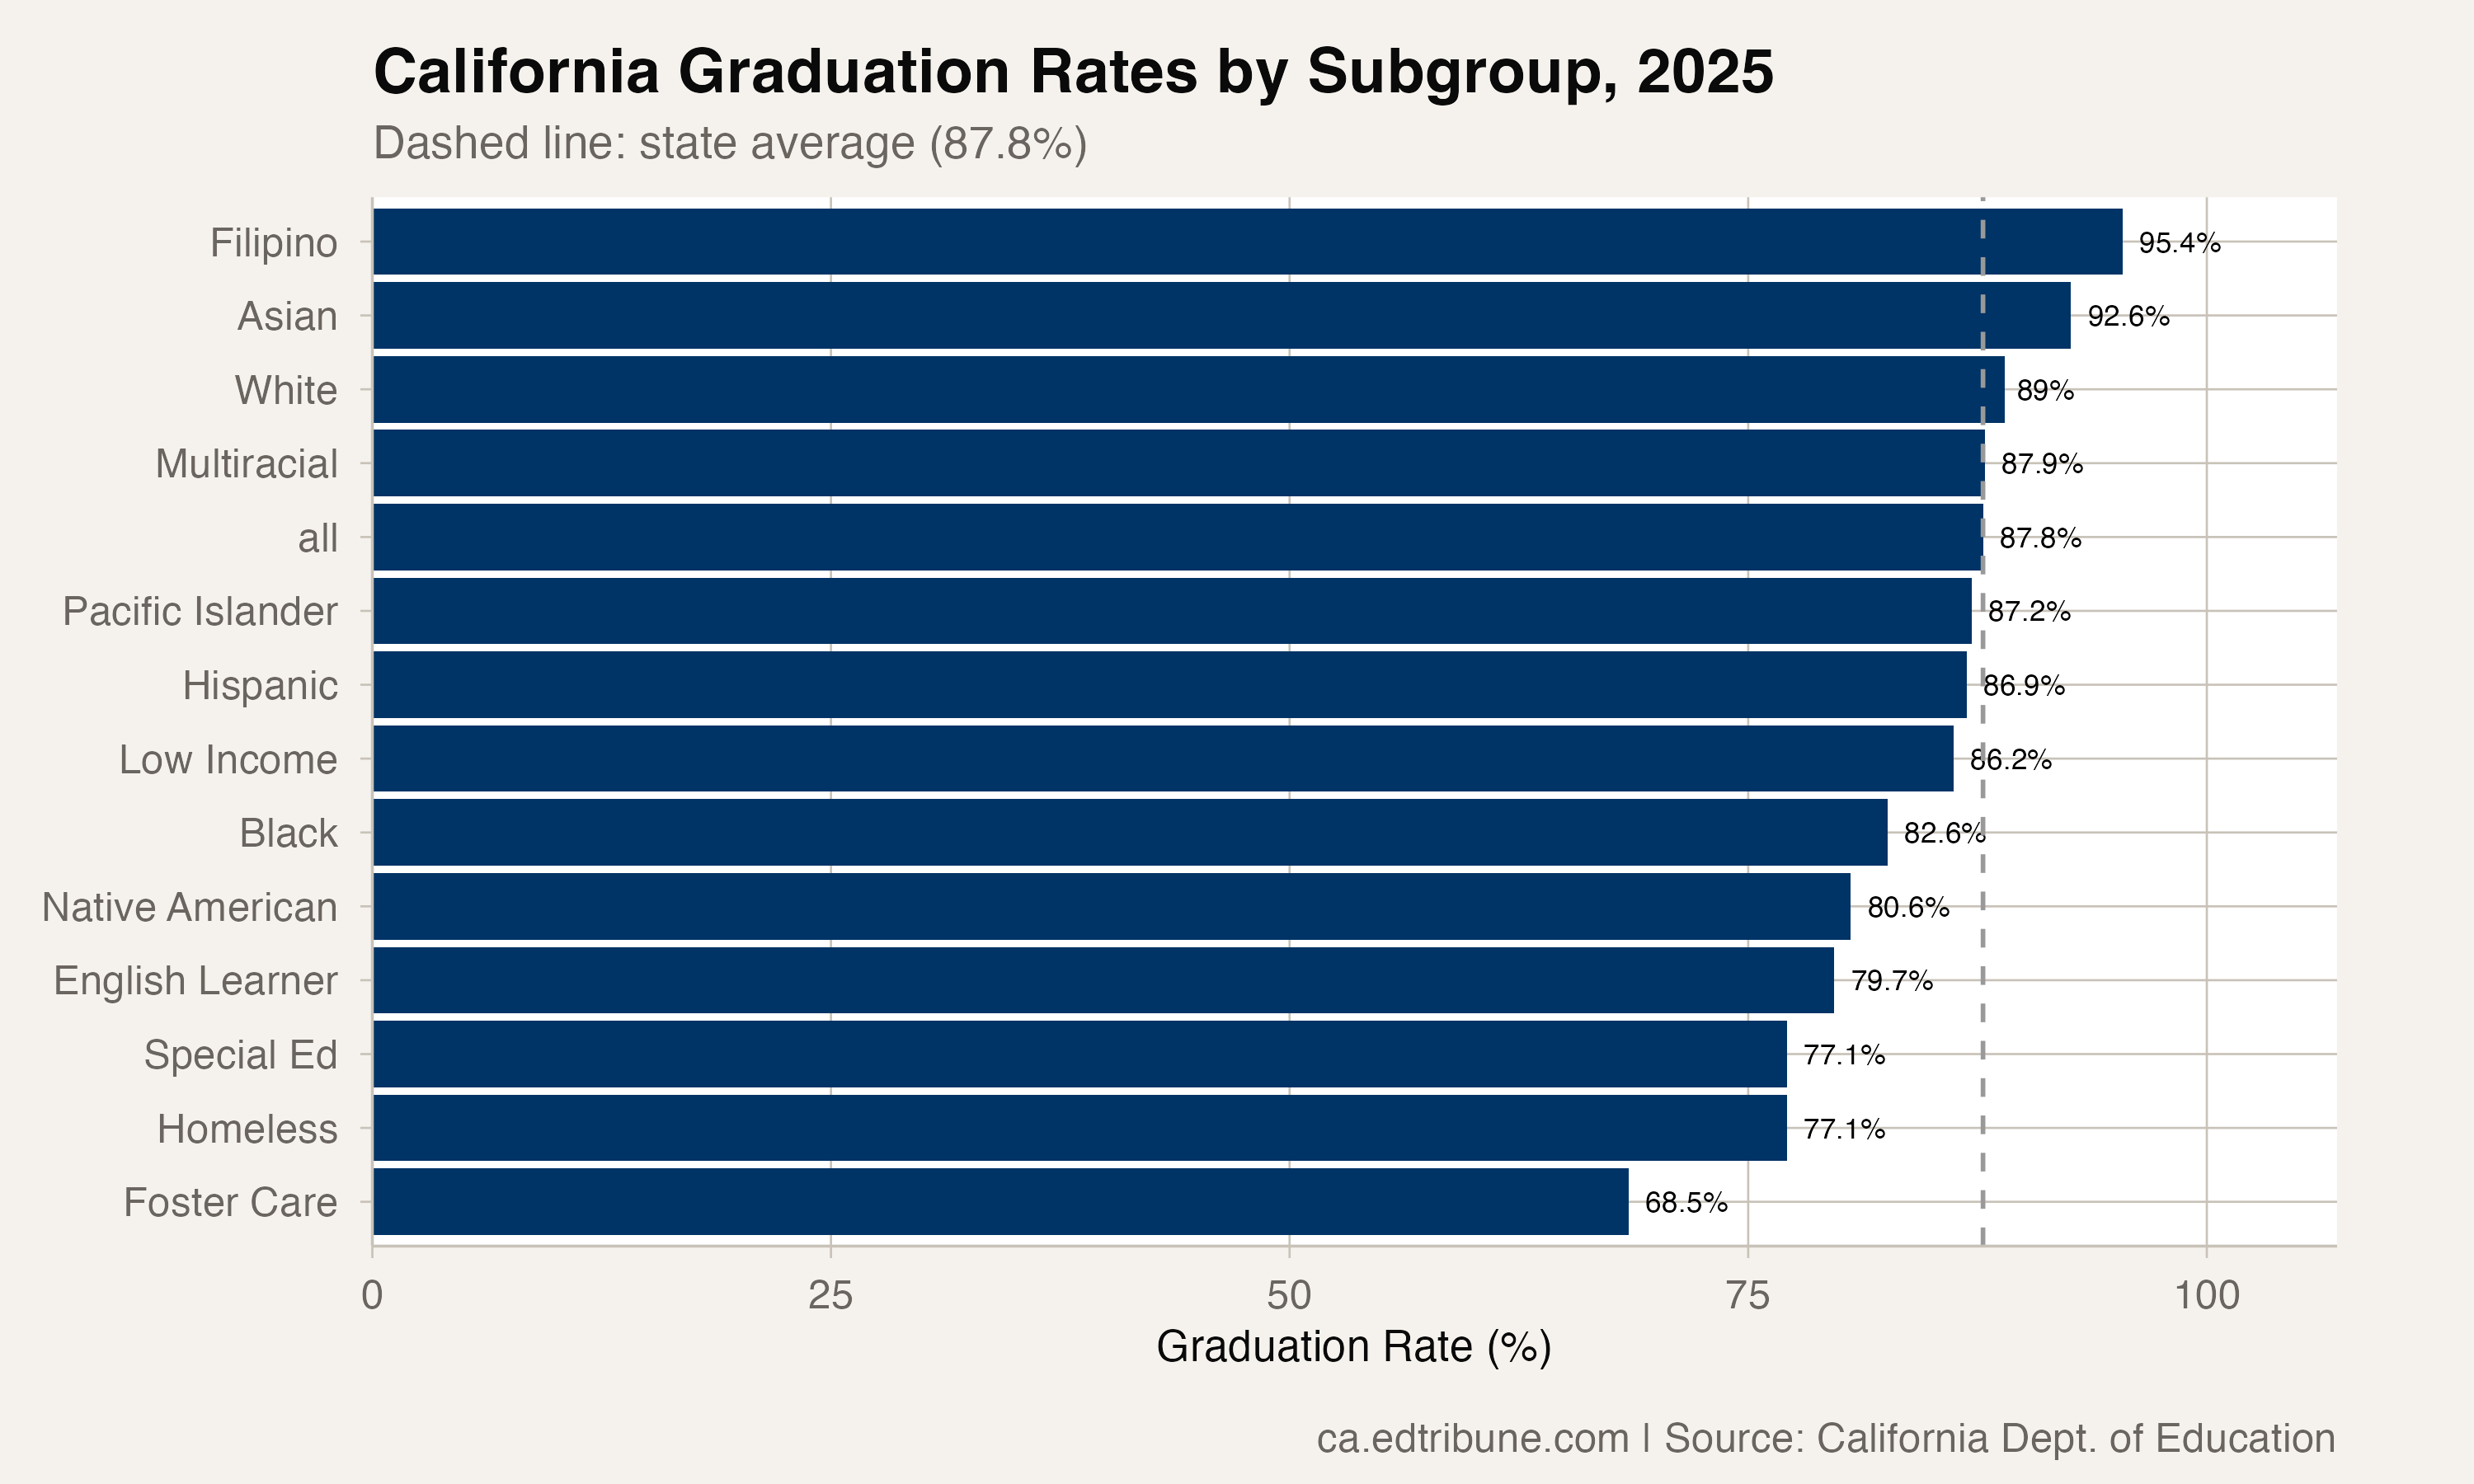
At the bottom: foster youth at 68.5%, special education students and students who are currently homeless each at 77.1%, and English learners at 79.7%. The gaps between these populations and the state average range from 8 to 19 points. The foster care gap alone -- 19.3 points -- represents roughly three times the remaining white-Black gap.
The 62,000
A rate of 87.8% applied to a cohort of 507,889 students means 445,720 graduated. The other 62,169 did not.
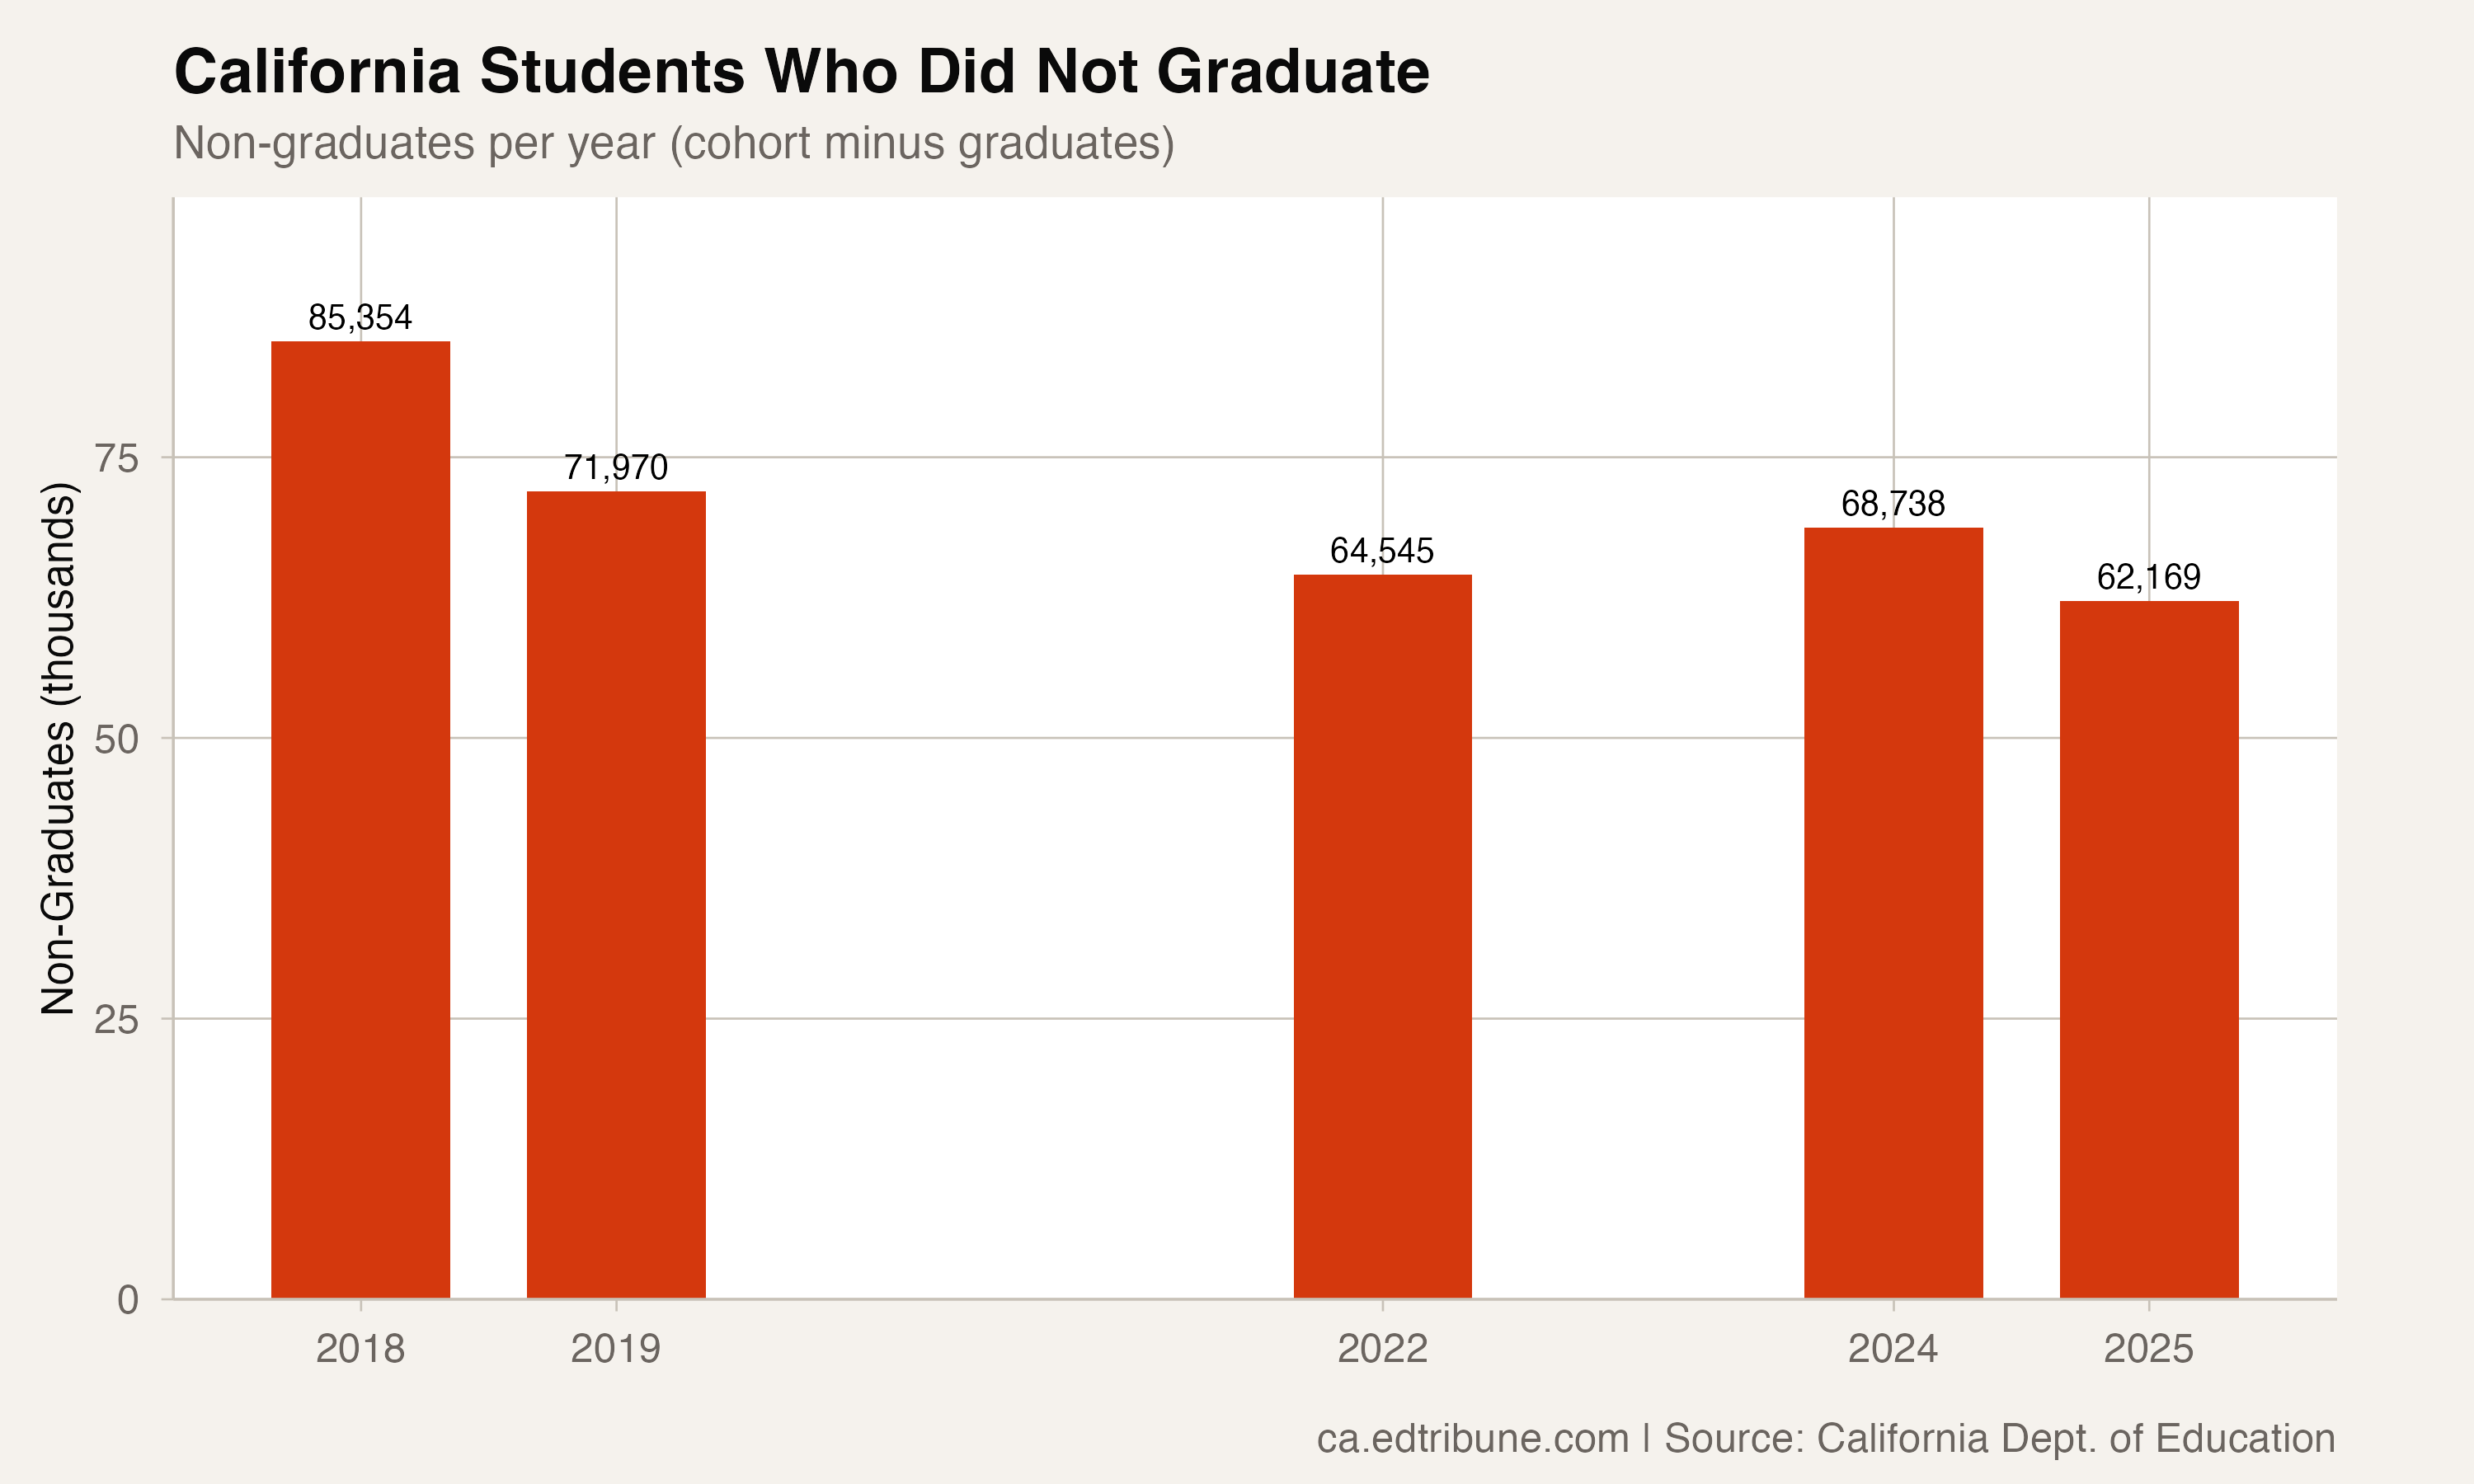
That number has been declining -- from 85,354 in 2018 -- but it remains enormous. Sixty-two thousand young Californians entered the workforce or the margins without a high school diploma in a single year. To put that in perspective, the non-graduate count exceeds the total enrollment of many California school districts.
The composition of those 62,000 is not random. They are disproportionately Hispanic, disproportionately low-income, disproportionately male (California does not report graduation rates by gender, but national patterns are consistent), and disproportionately from Southern California and Central Valley districts.
The 90% Question
Many states have crossed the 90% threshold. California has not, despite seven years of gains. At the current pace -- roughly 1 point per year when the dip years are excluded -- the state might reach 90% by 2028 or 2029.
But the pace is likely to slow. Gains become harder as rates climb because the remaining non-graduates face increasingly entrenched barriers: foster care instability, homelessness, severe disabilities, chronic absenteeism, involvement with the justice system. The last 2.2 points to 90% will be more difficult than the first 4.3 points were.
California's size is also a factor. States that have crossed 90% tend to be smaller and more homogeneous. Reaching 90% across a system of 441 districts, 507,889 students, 15 tracked subgroups, and enormous geographic and demographic variation is a different challenge than doing so in a state with 50 districts.
What Changed
The data cannot isolate causation, but several structural changes coincide with the improvement period. The Local Control Funding Formula, which directs additional resources to high-need students, was fully implemented. Community schools expanded statewide. Transitional kindergarten was universalized. College readiness requirements were strengthened. The state increased investments in after-school and extended learning programs.
The 2024 dip -- the one year the rate declined -- may have reflected the end of pandemic-era flexibility, when districts temporarily relaxed requirements and offered credit recovery at scale. If so, the 2025 rebound suggests the underlying improvement is real, not an artifact of temporary leniency.
The 141 districts above 95% show what is possible. The 62,169 non-graduates show what remains.
Detailed code that reproduces the analysis and figures in this article is available exclusively to EdTribune subscribers.
Discussion
Sign in to join the discussion.
Loading comments...