Compton Unified↗ET's graduation rate in 2025 was 93.7%.
That number, on its own, would be unremarkable for a suburban district. But Compton is not suburban in any conventional sense, and the number is remarkable because of where the district started. Education Week has reported that the state seized control of Compton Unified in 1993 after the district ran up $19.6 million in debt amid allegations of nepotism and cronyism, and that it took nearly eight years for the district to work its way back toward local control. A little over a decade ago, Compton's graduation rate still stood at 58% when Superintendent Darin Brawley took over in 2012, USC's Rossier School of Education has reported.
Thirteen years later, Compton not only graduates at 93.7%, it does so nearly six points above the California state average.
The Data Window
The California Department of Education data available through the current release covers 2018 through 2025, with gaps during the COVID waiver years. Within that window, Compton Unified posted five consecutive increases:
- 2018: 83.5%
- 2019: 87.1%
- 2022: 89.3%
- 2024: 92.9%
- 2025: 93.7%
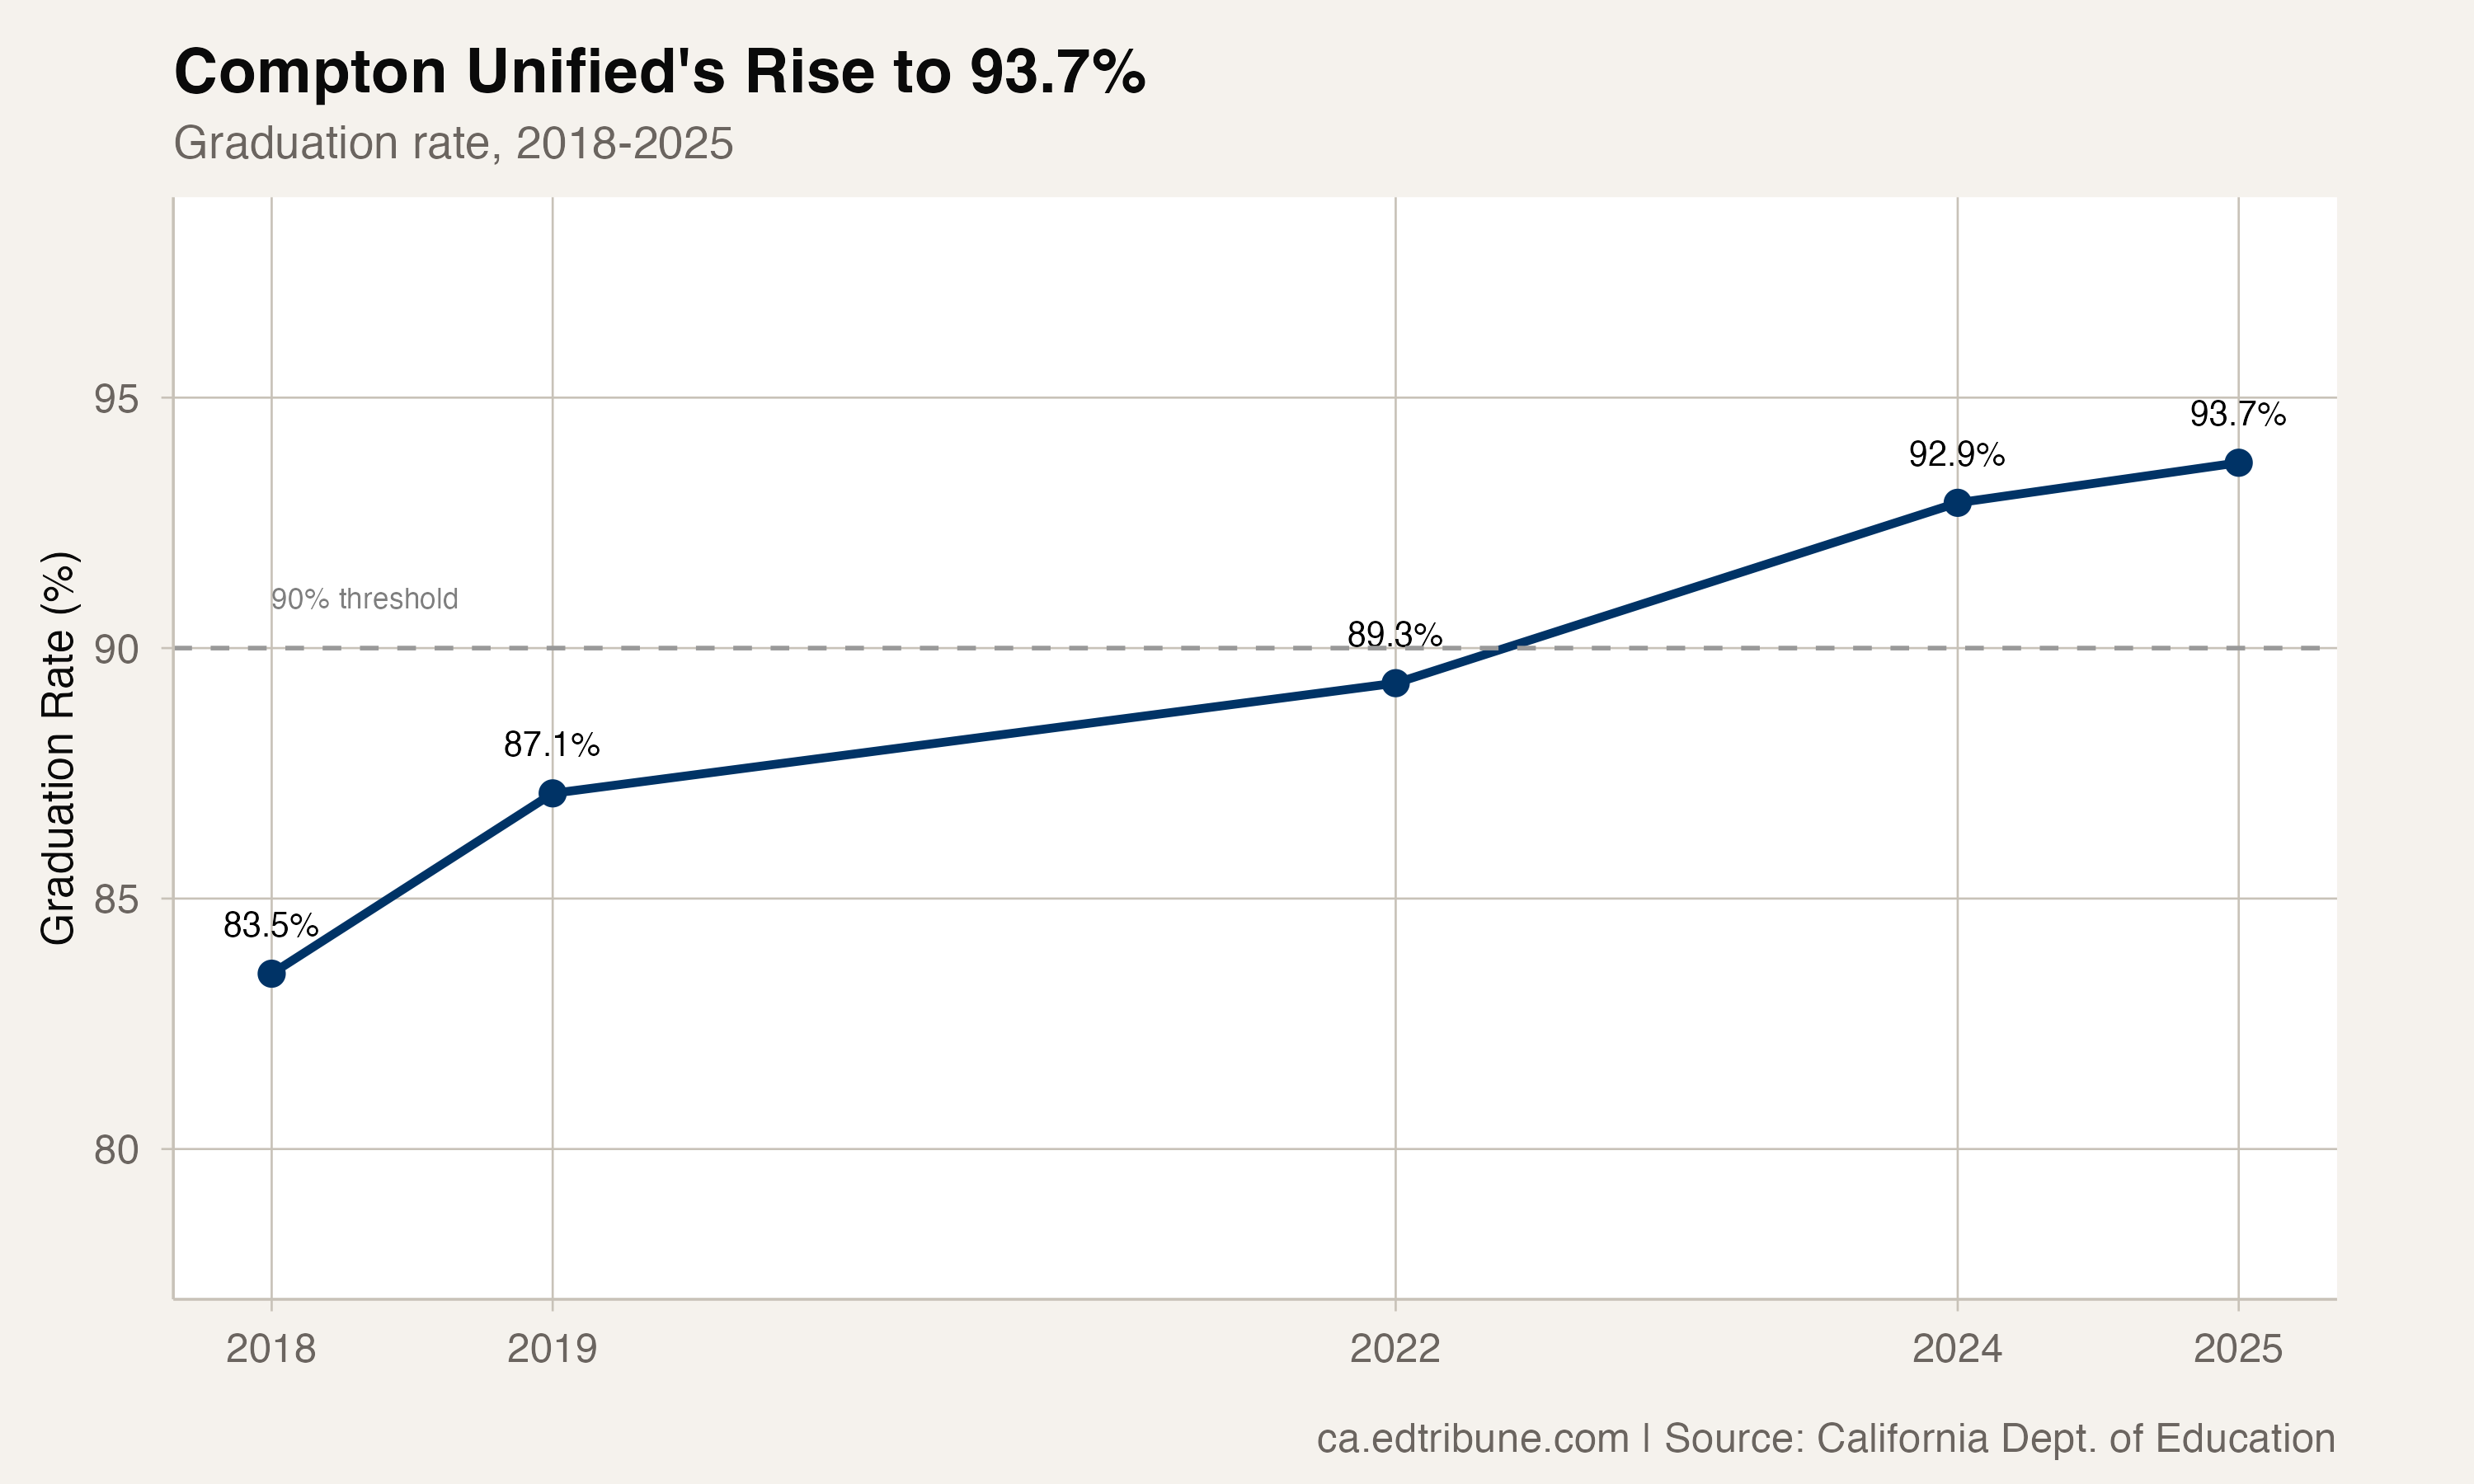
The improvement of 10.2 percentage points across this window understates the full arc. The broader transformation, which began in the early 2010s after Compton narrowly avoided a second state receivership amid a fiscal crisis, has unfolded over more than a decade and across multiple superintendent tenures and policy regimes. Superintendent Darin Brawley, who has led the district through the most recent years, has credited intentional systems and strategic resource allocation for the turnaround, according to the district.
Outpacing the State
In 2018, Compton's 83.5% graduation rate was exactly equal to the state average. By 2025, the district had opened a 5.9-point lead. The crossover happened around 2019, when Compton pulled ahead of the state for the first time. It has not looked back.
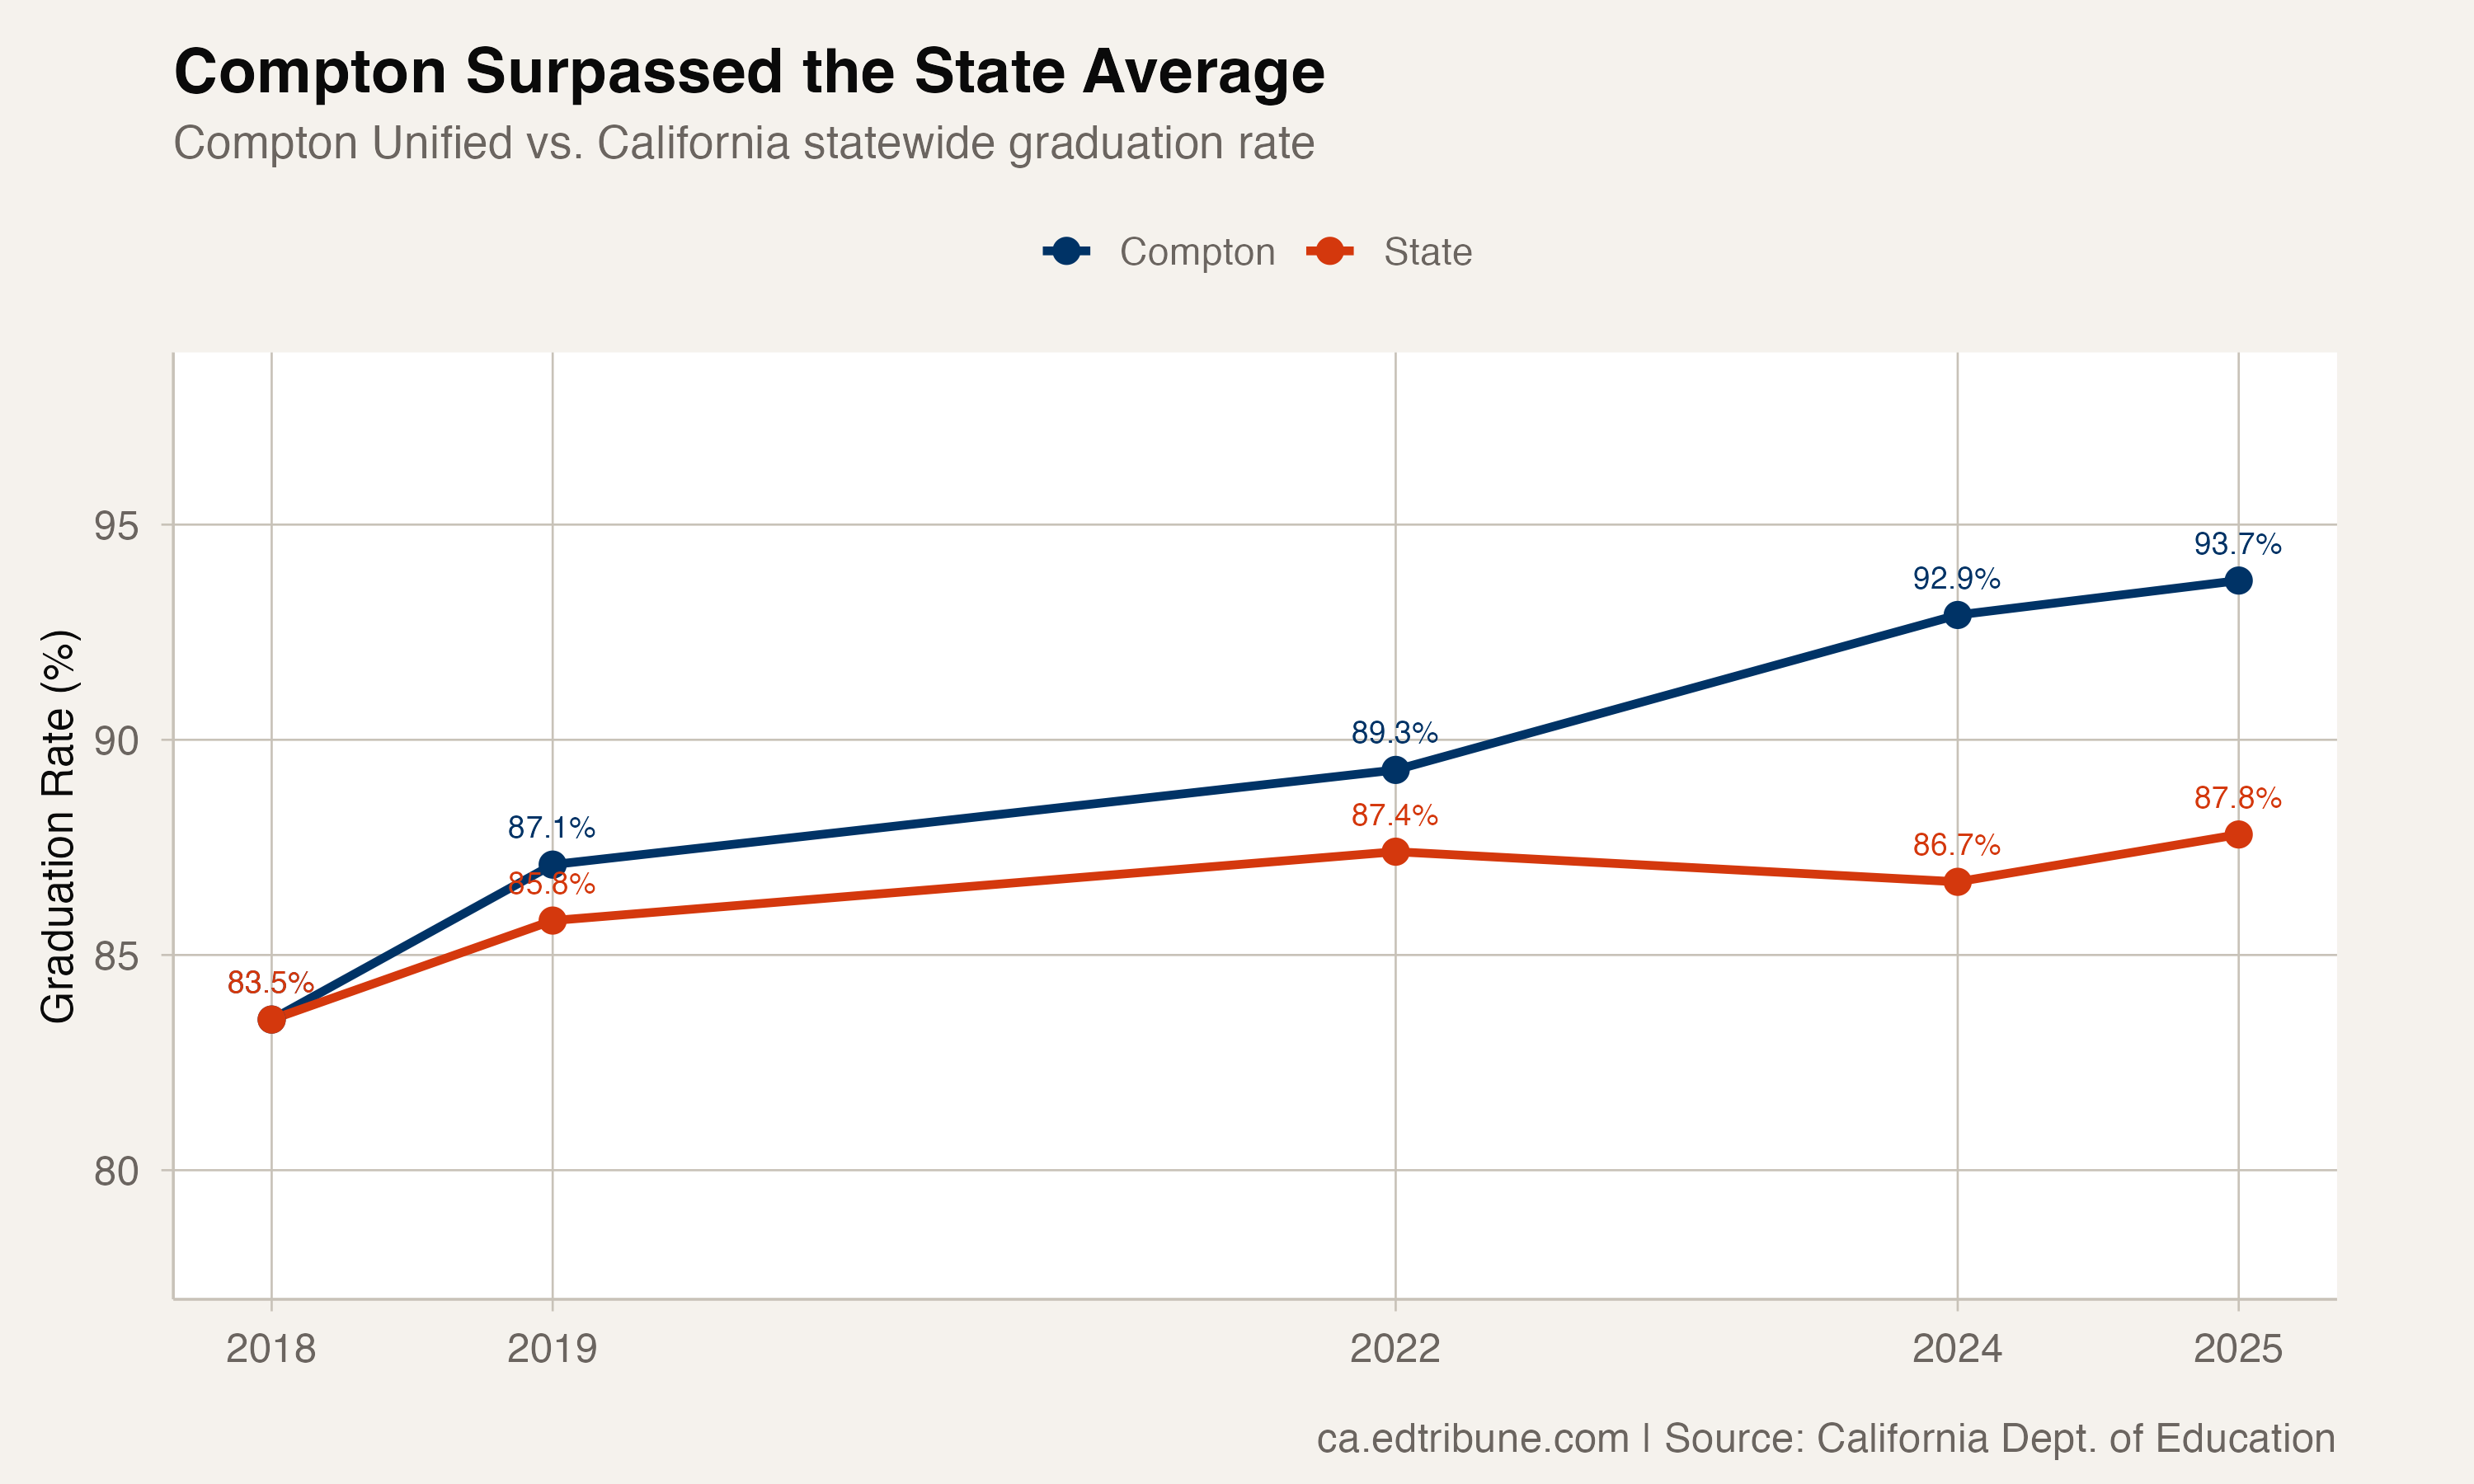
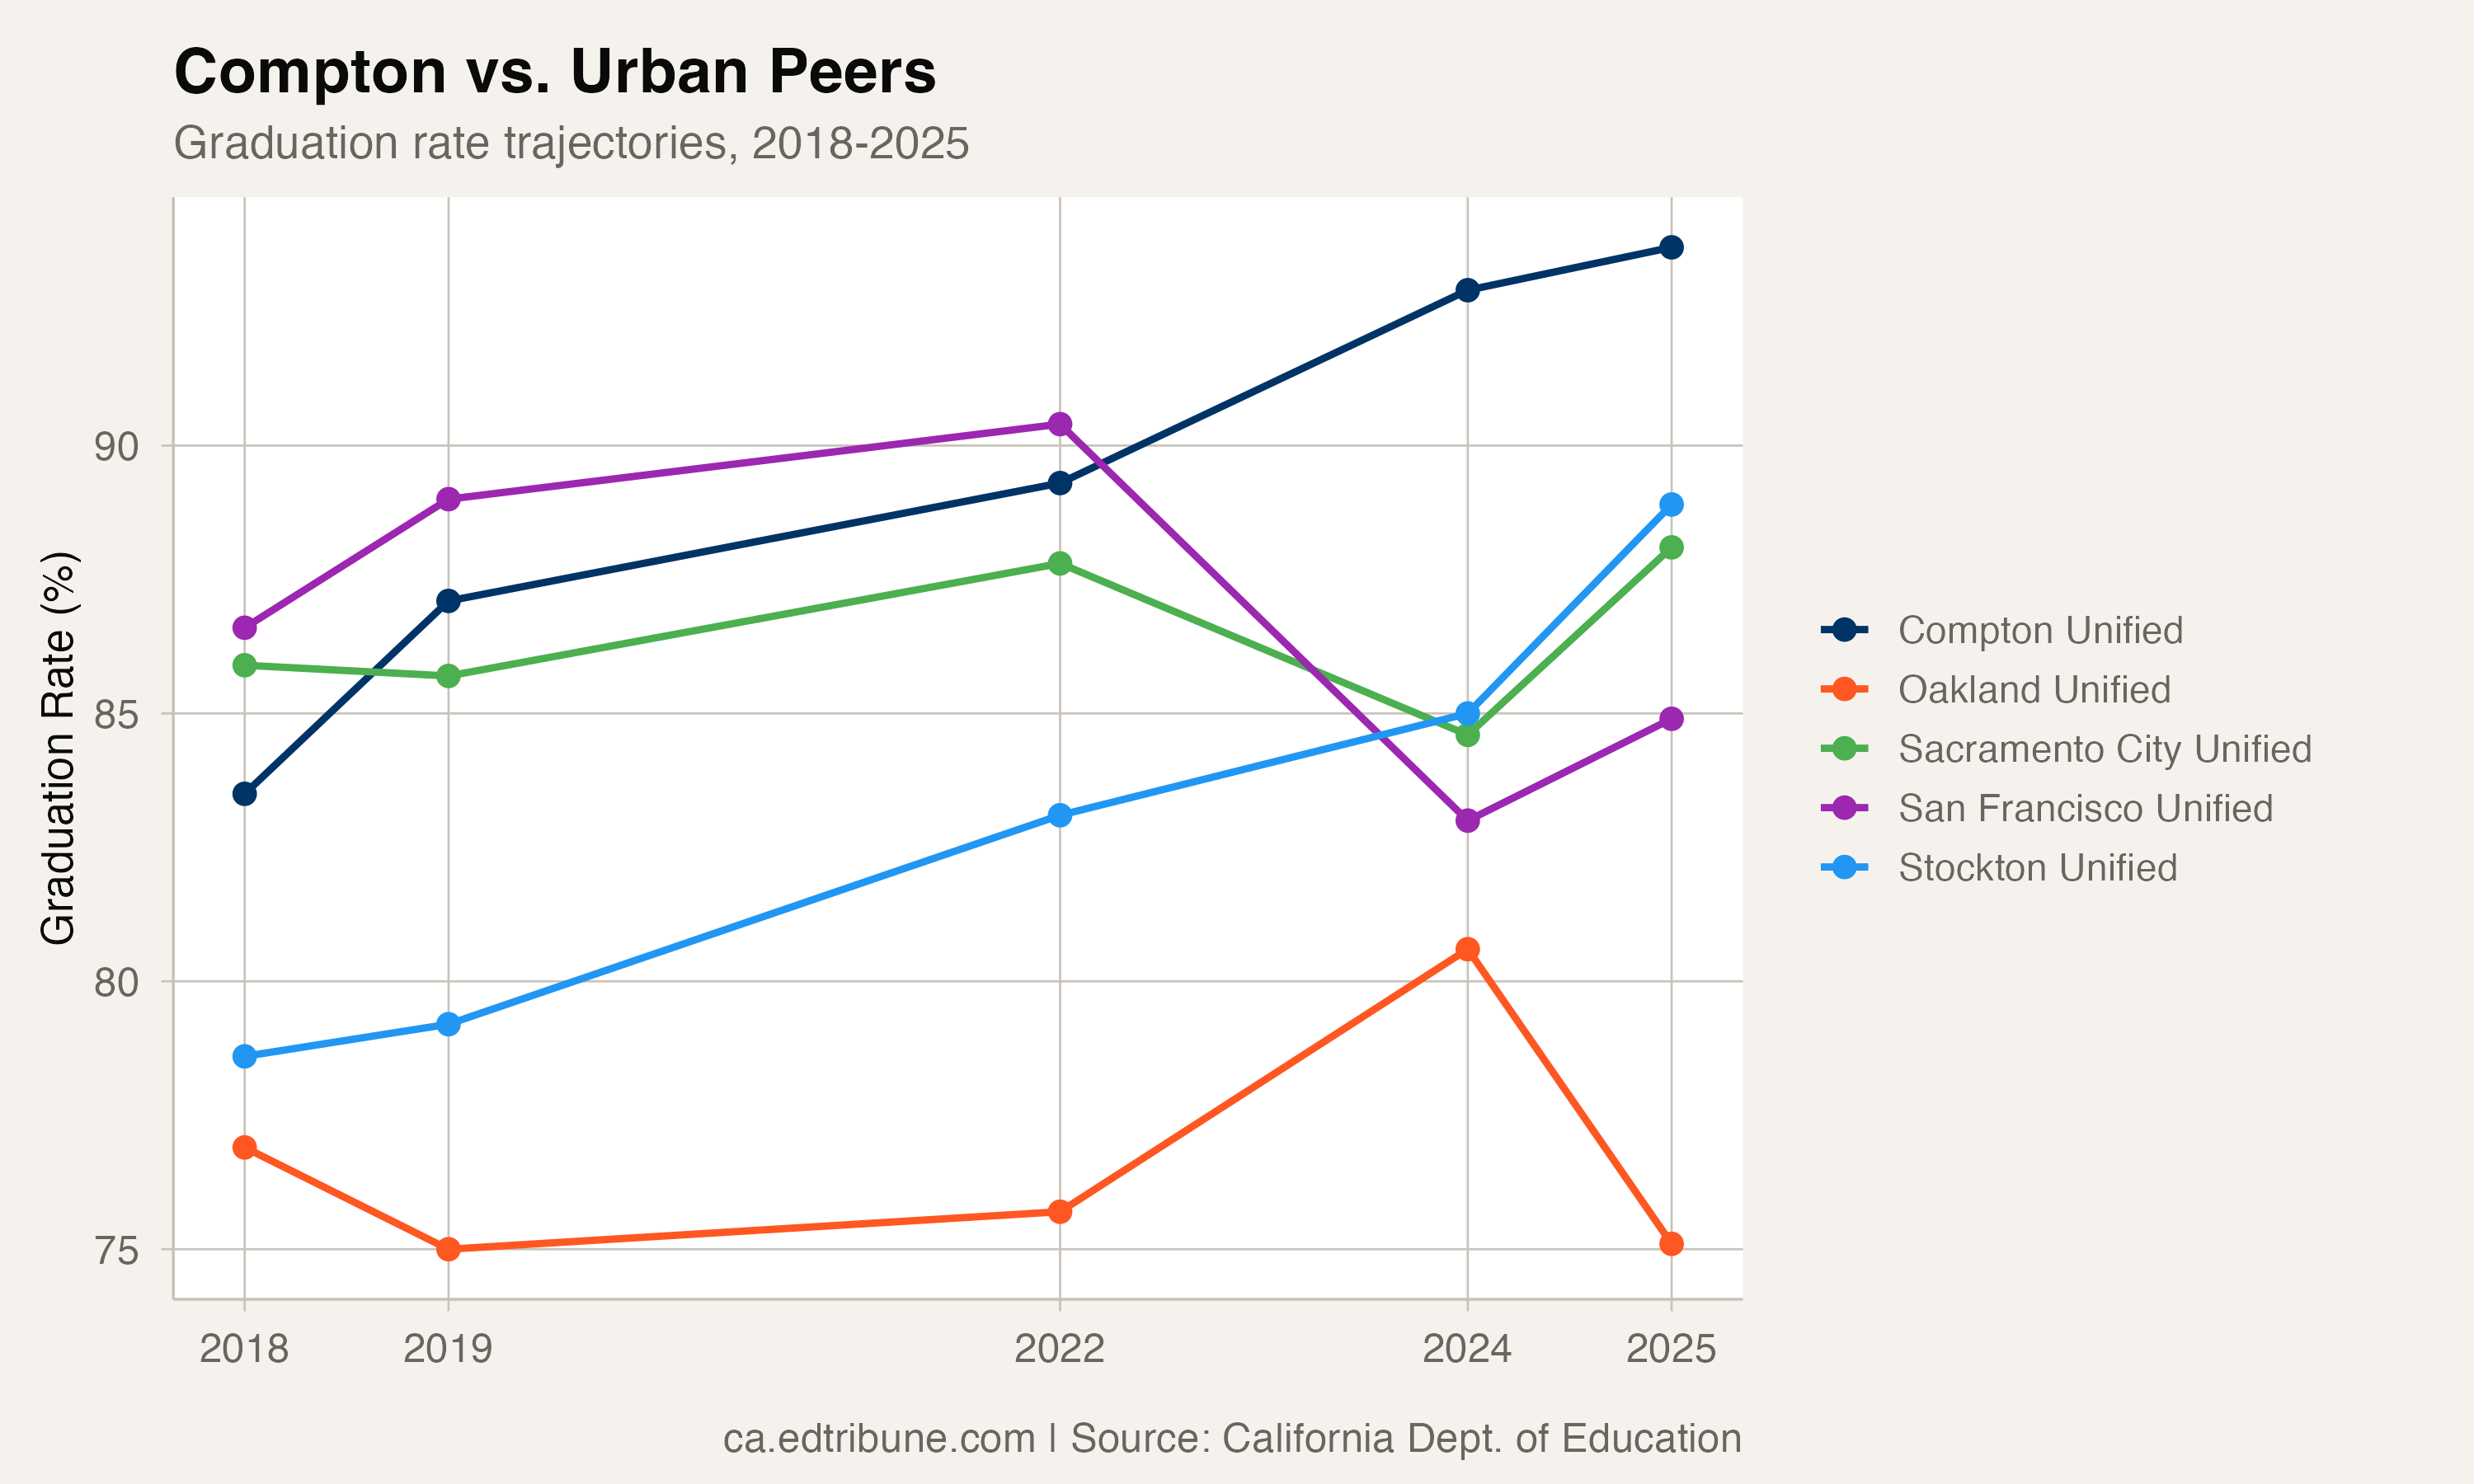
That trajectory stands in sharp contrast to other urban districts over the same period. Oakland Unified↗ET sat at 76.9% in 2018, climbed to 80.6% in 2024, then fell back to 75.1% in 2025. San Francisco Unified↗ET slid from a peak of 90.4% in 2022 to 84.9%. Stockton Unified↗ET improved impressively, from 78.6% to 88.9%, but has not yet matched Compton's rate.
Who Graduates at Compton
Compton's 2025 cohort of 1,225 students is heavily Hispanic (1,046 students, or 85%) and overwhelmingly low-income (1,197 of 1,225, or 98%). The subgroup breakdown reveals broad success, not a single-group story:
- Hispanic students: 94.3%
- Students from low-income families: 93.7%
- Black students: 90.1%
- English learners: 88.5%
- Students with special needs: 87.4%
- Students experiencing homelessness: 84.5%
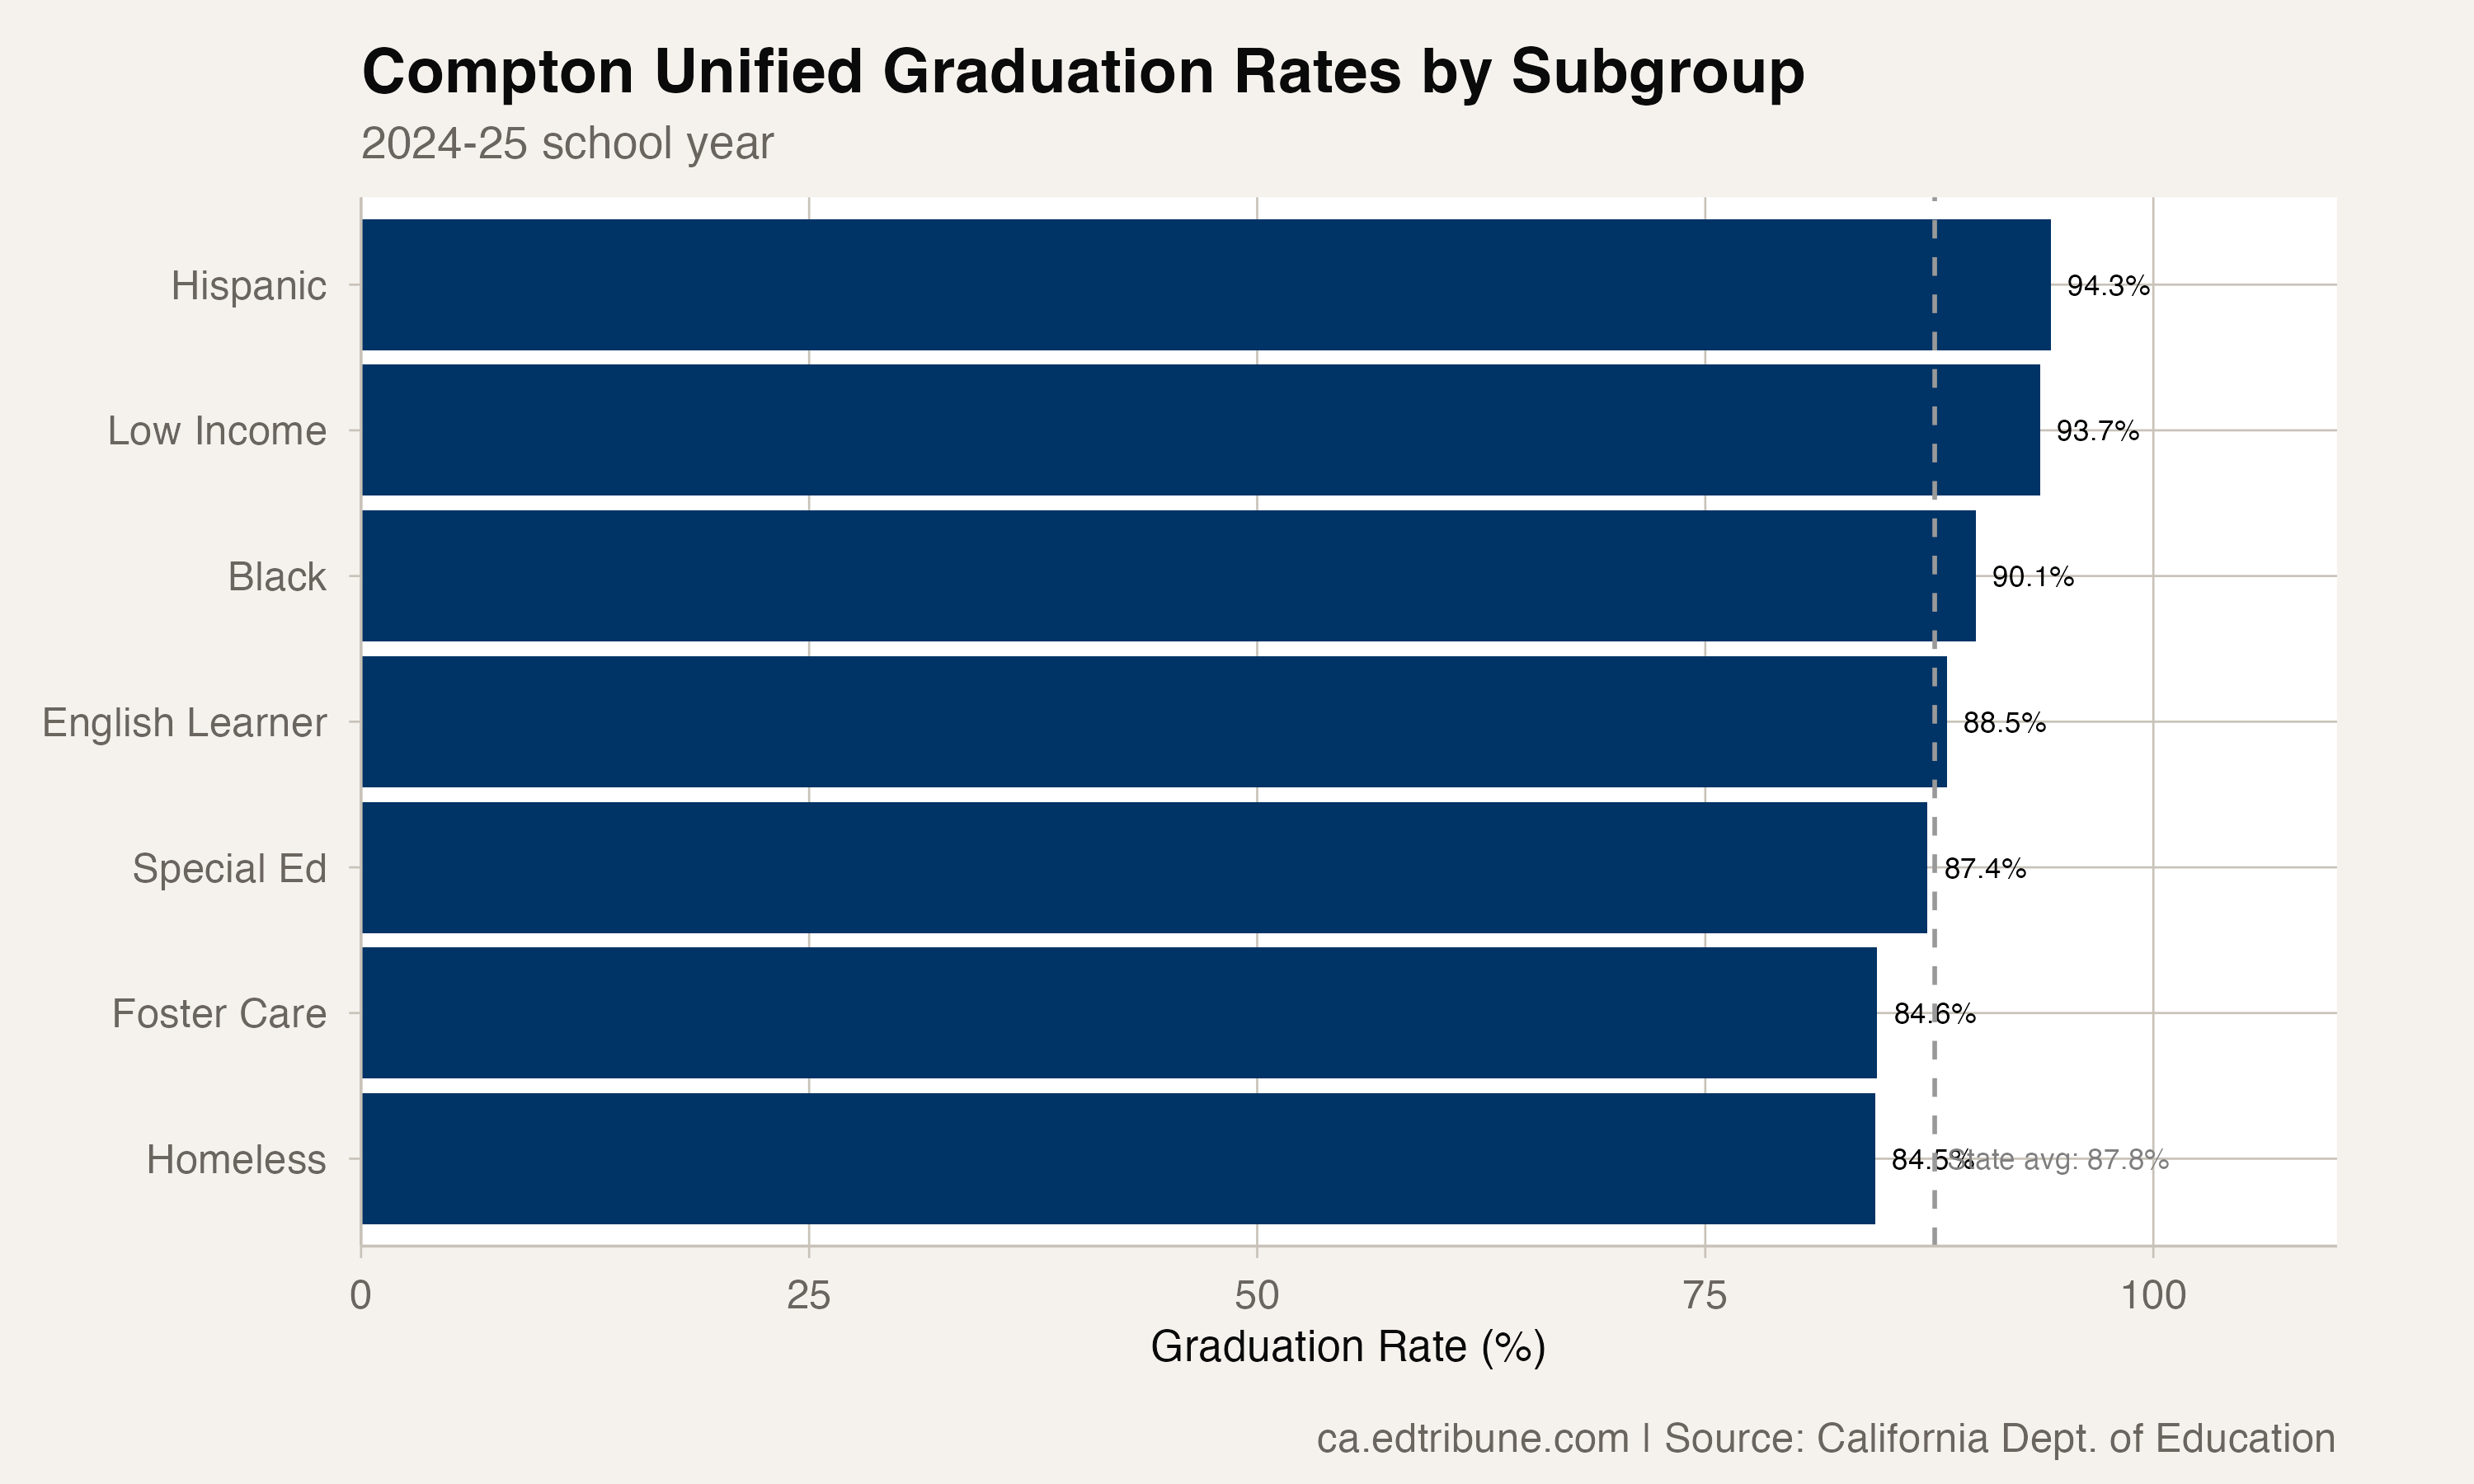
Every subgroup with a meaningful cohort exceeds 84%. The special education rate of 87.4% is more than 10 points above the state special education average of 77.1%. The English learner rate of 88.5% exceeds the state EL average of 79.7% by nearly nine points.
The Unanswered Question
The data confirms the transformation. What it cannot fully explain is the mechanism. Compton's improvement predates the state's major LCFF funding formula changes, spans multiple policy eras, and has accelerated even as other districts with similar demographics stalled or declined.
Among the 71 districts with cohorts between 1,000 and 2,000 students, Compton's 93.7% lands right at the median. What makes the number exceptional is not the rank but the starting point and the demographics: a majority-Hispanic, nearly-universally low-income district in a community that was once synonymous with educational failure now performs at the same level as the typical district its size, with substantially fewer resources.
The A-G completion rate -- the percentage of graduates meeting University of California and California State University entrance requirements -- rose from 14% to 68% under Superintendent Darin Brawley, USC's Rossier School of Education has reported. That number, which is not in the graduation data, suggests the improvement is not merely about getting students to the finish line but about the quality of the education on the way there.
Detailed code that reproduces the analysis and figures in this article is available exclusively to EdTribune subscribers.
Discussion
Sign in to join the discussion.
Loading comments...