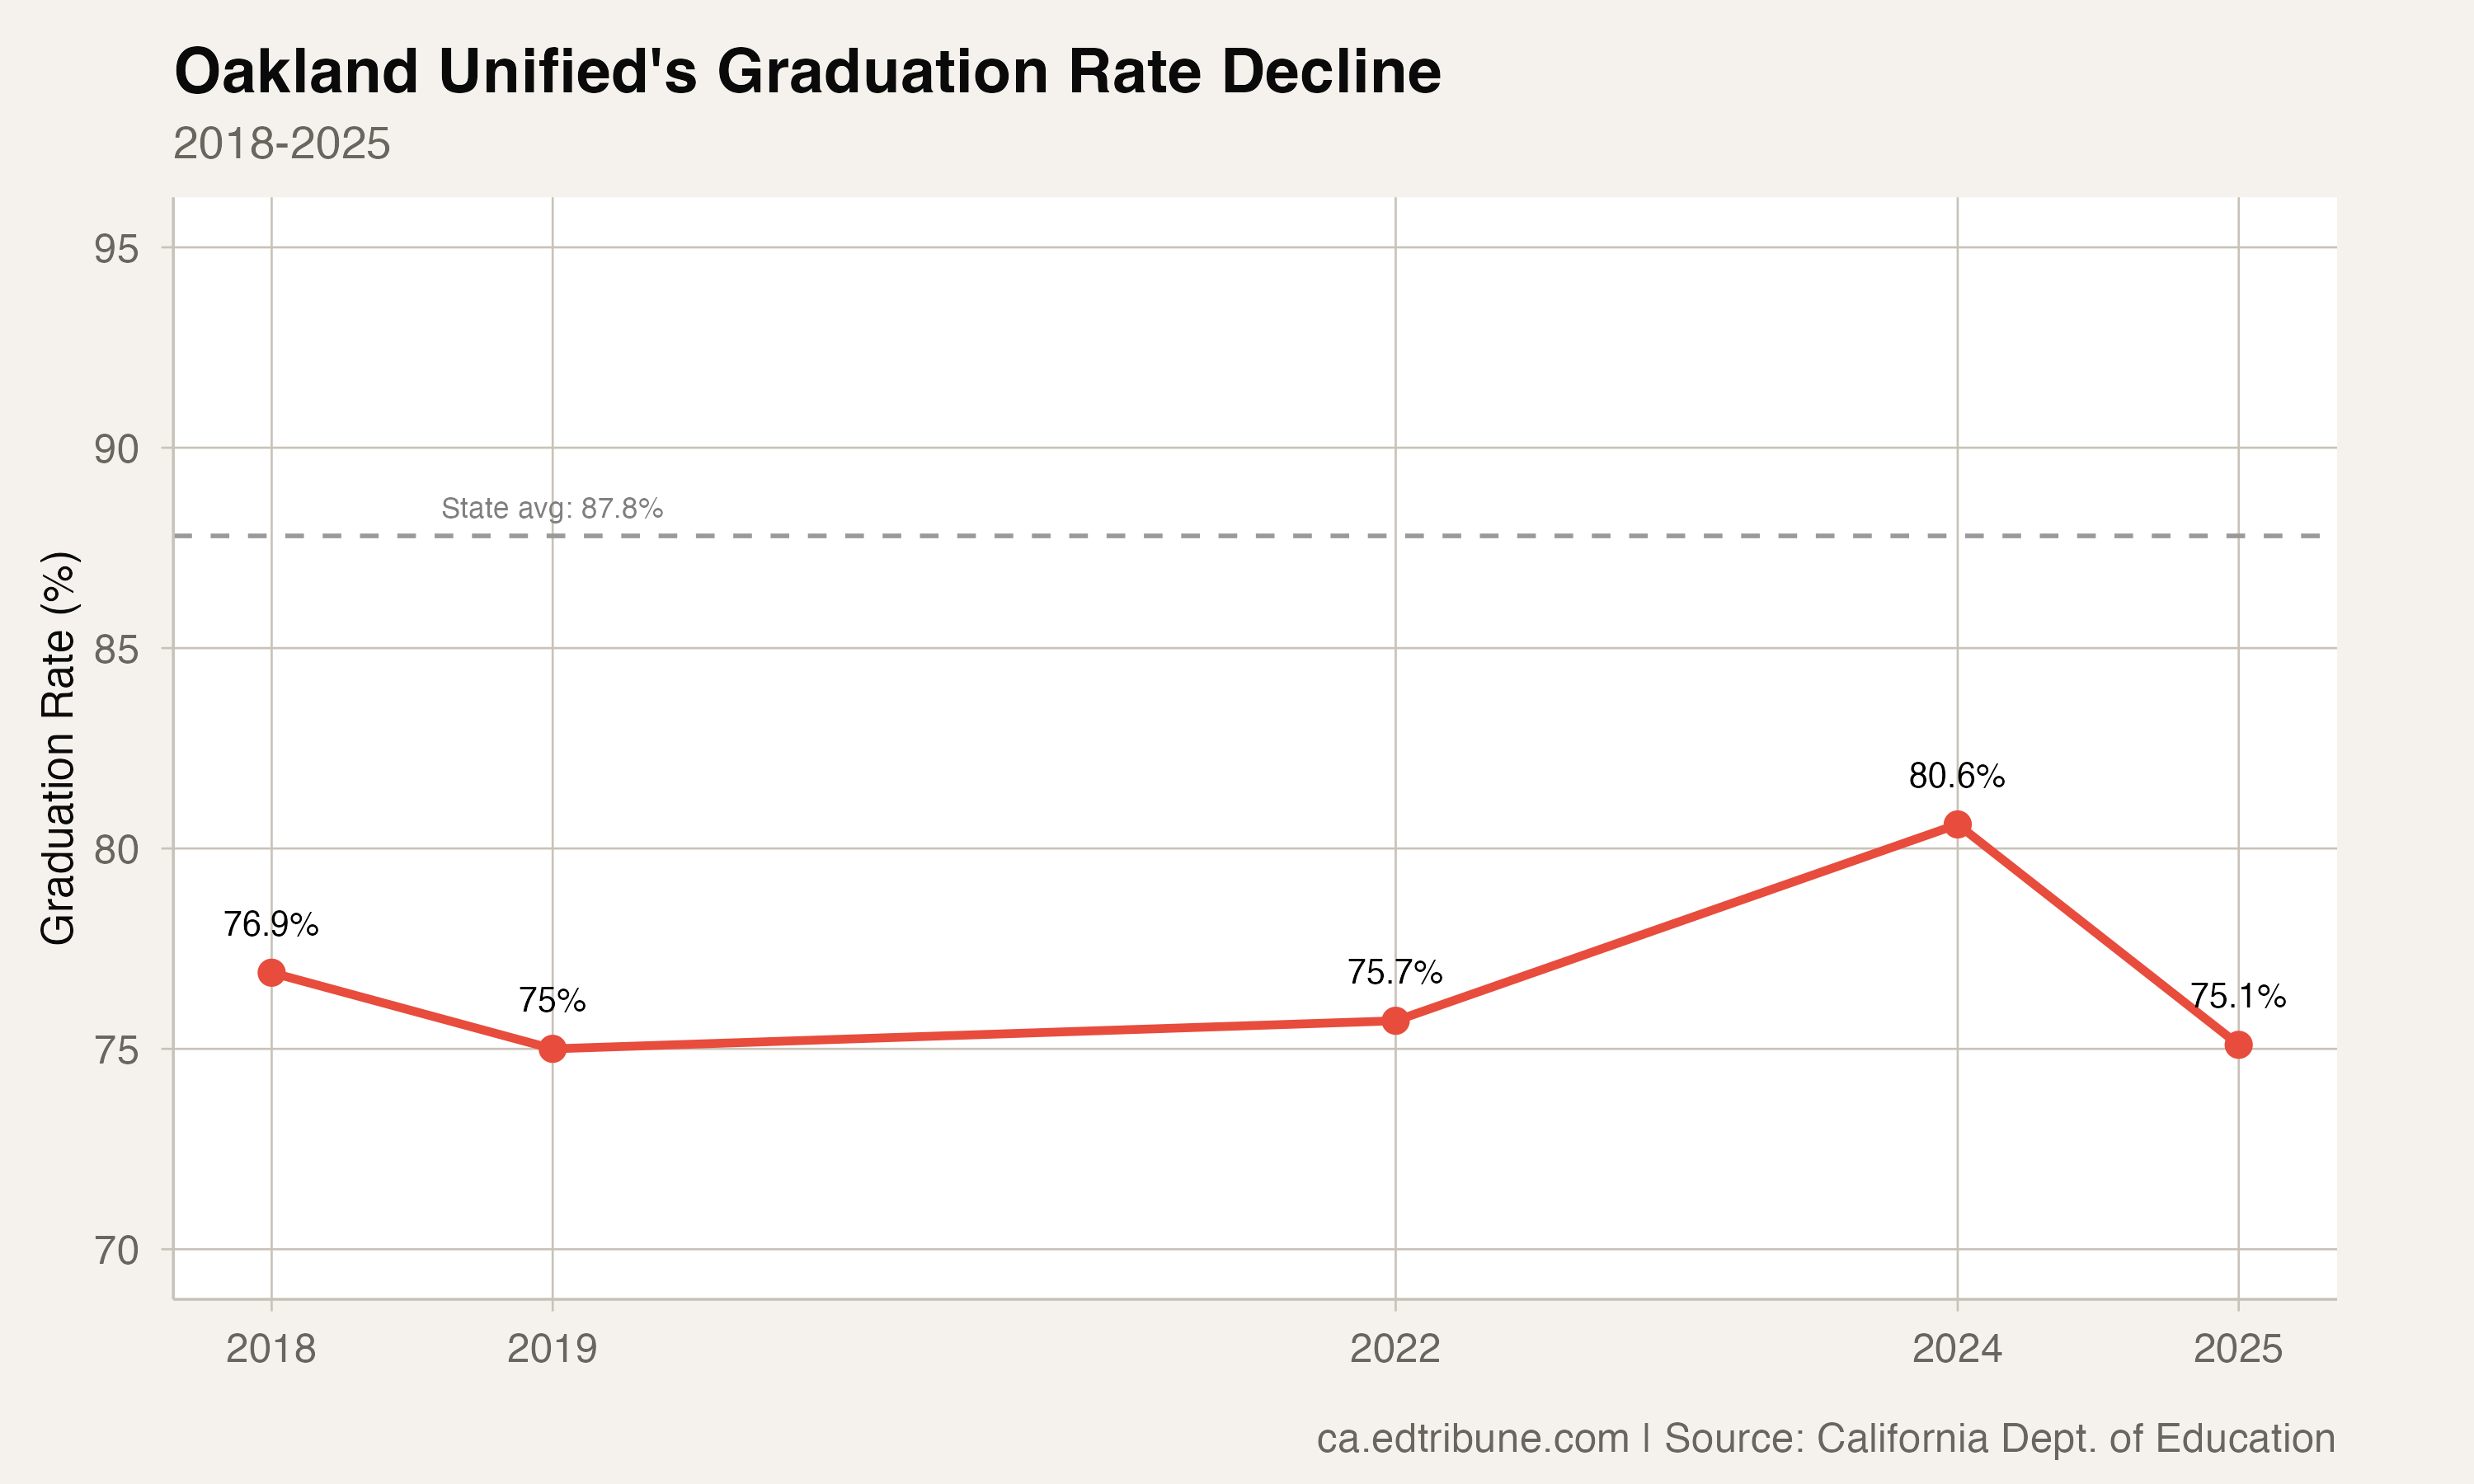
Oakland Unified↗ET's graduation rate fell 5.5 percentage points in a single year, from 80.6% in 2024 to 75.1% in 2025. No other large California district came close to that kind of decline. The next-largest drop among districts with 2,000 or more students was Merced Union High's 1.6-point decrease.
The plunge erased what had looked like progress. Oakland's 80.6% in 2024 was its best mark in the available data, a rate that had briefly pulled the district within striking distance of the state average. One year later, the district sits 12.7 points below the state's 87.8% and at the bottom of every large urban comparison in California.
The Urban Ranking
Among California's largest urban districts, the hierarchy in 2025 is stark:
- Santa Ana Unified↗ET: 91.6%
- Fresno Unified↗ET: 90.8%
- San Diego Unified↗ET: 90.3%
- Sacramento City Unified↗ET: 88.1%
- Long Beach Unified↗ET: 87.4%
- Los Angeles Unified↗ET: 86.5%
- San Francisco Unified↗ET: 84.9%
- Oakland Unified: 75.1%
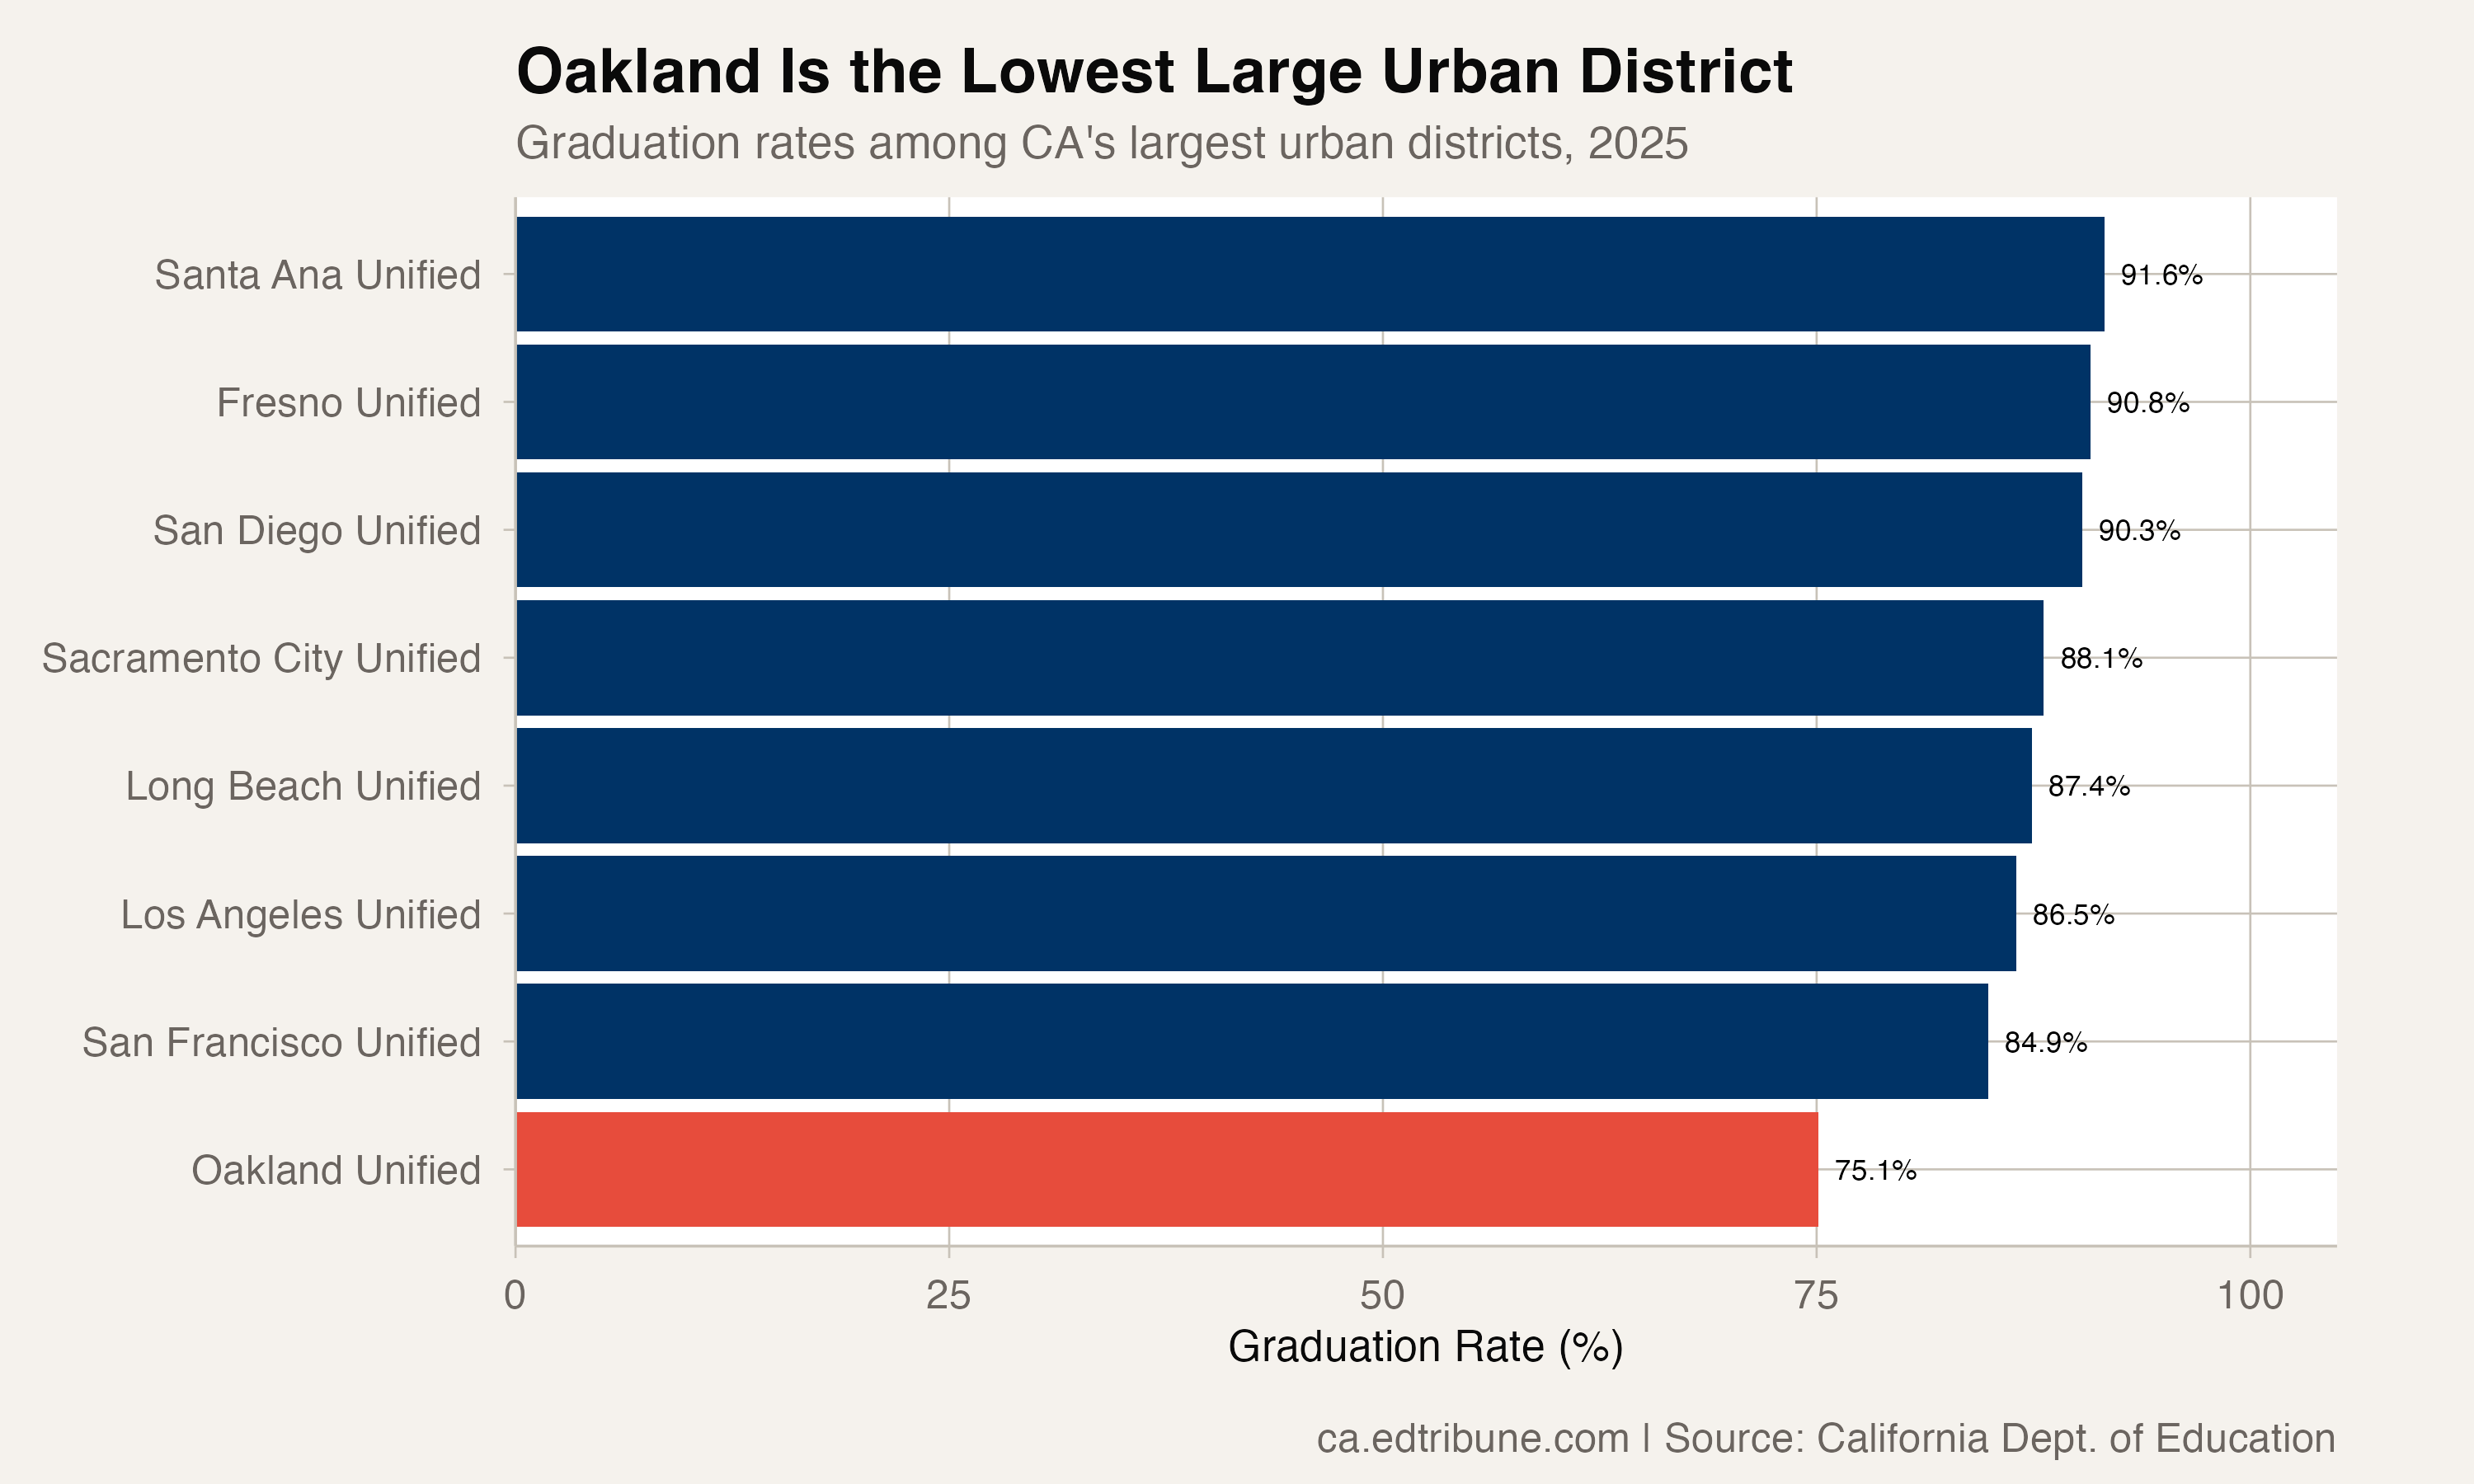
Oakland is not just at the bottom -- it is separated from the next-lowest by nearly 10 points. San Francisco Unified, which has its own problems at 84.9% (down from a 90.4% peak in 2022), still graduates roughly 10 out of every 100 students that Oakland does not.
Inside the Numbers
Oakland's 2025 cohort of 2,800 students is diverse and high-need. The subgroup breakdown reveals how deeply the decline cuts:
- Students who are currently homeless: 59.5% (573 students)
- English learners: 61.4% (1,086 students)
- Hispanic students: 68.7% (1,503 students)
- Students receiving special education services: 69.3% (436 students)
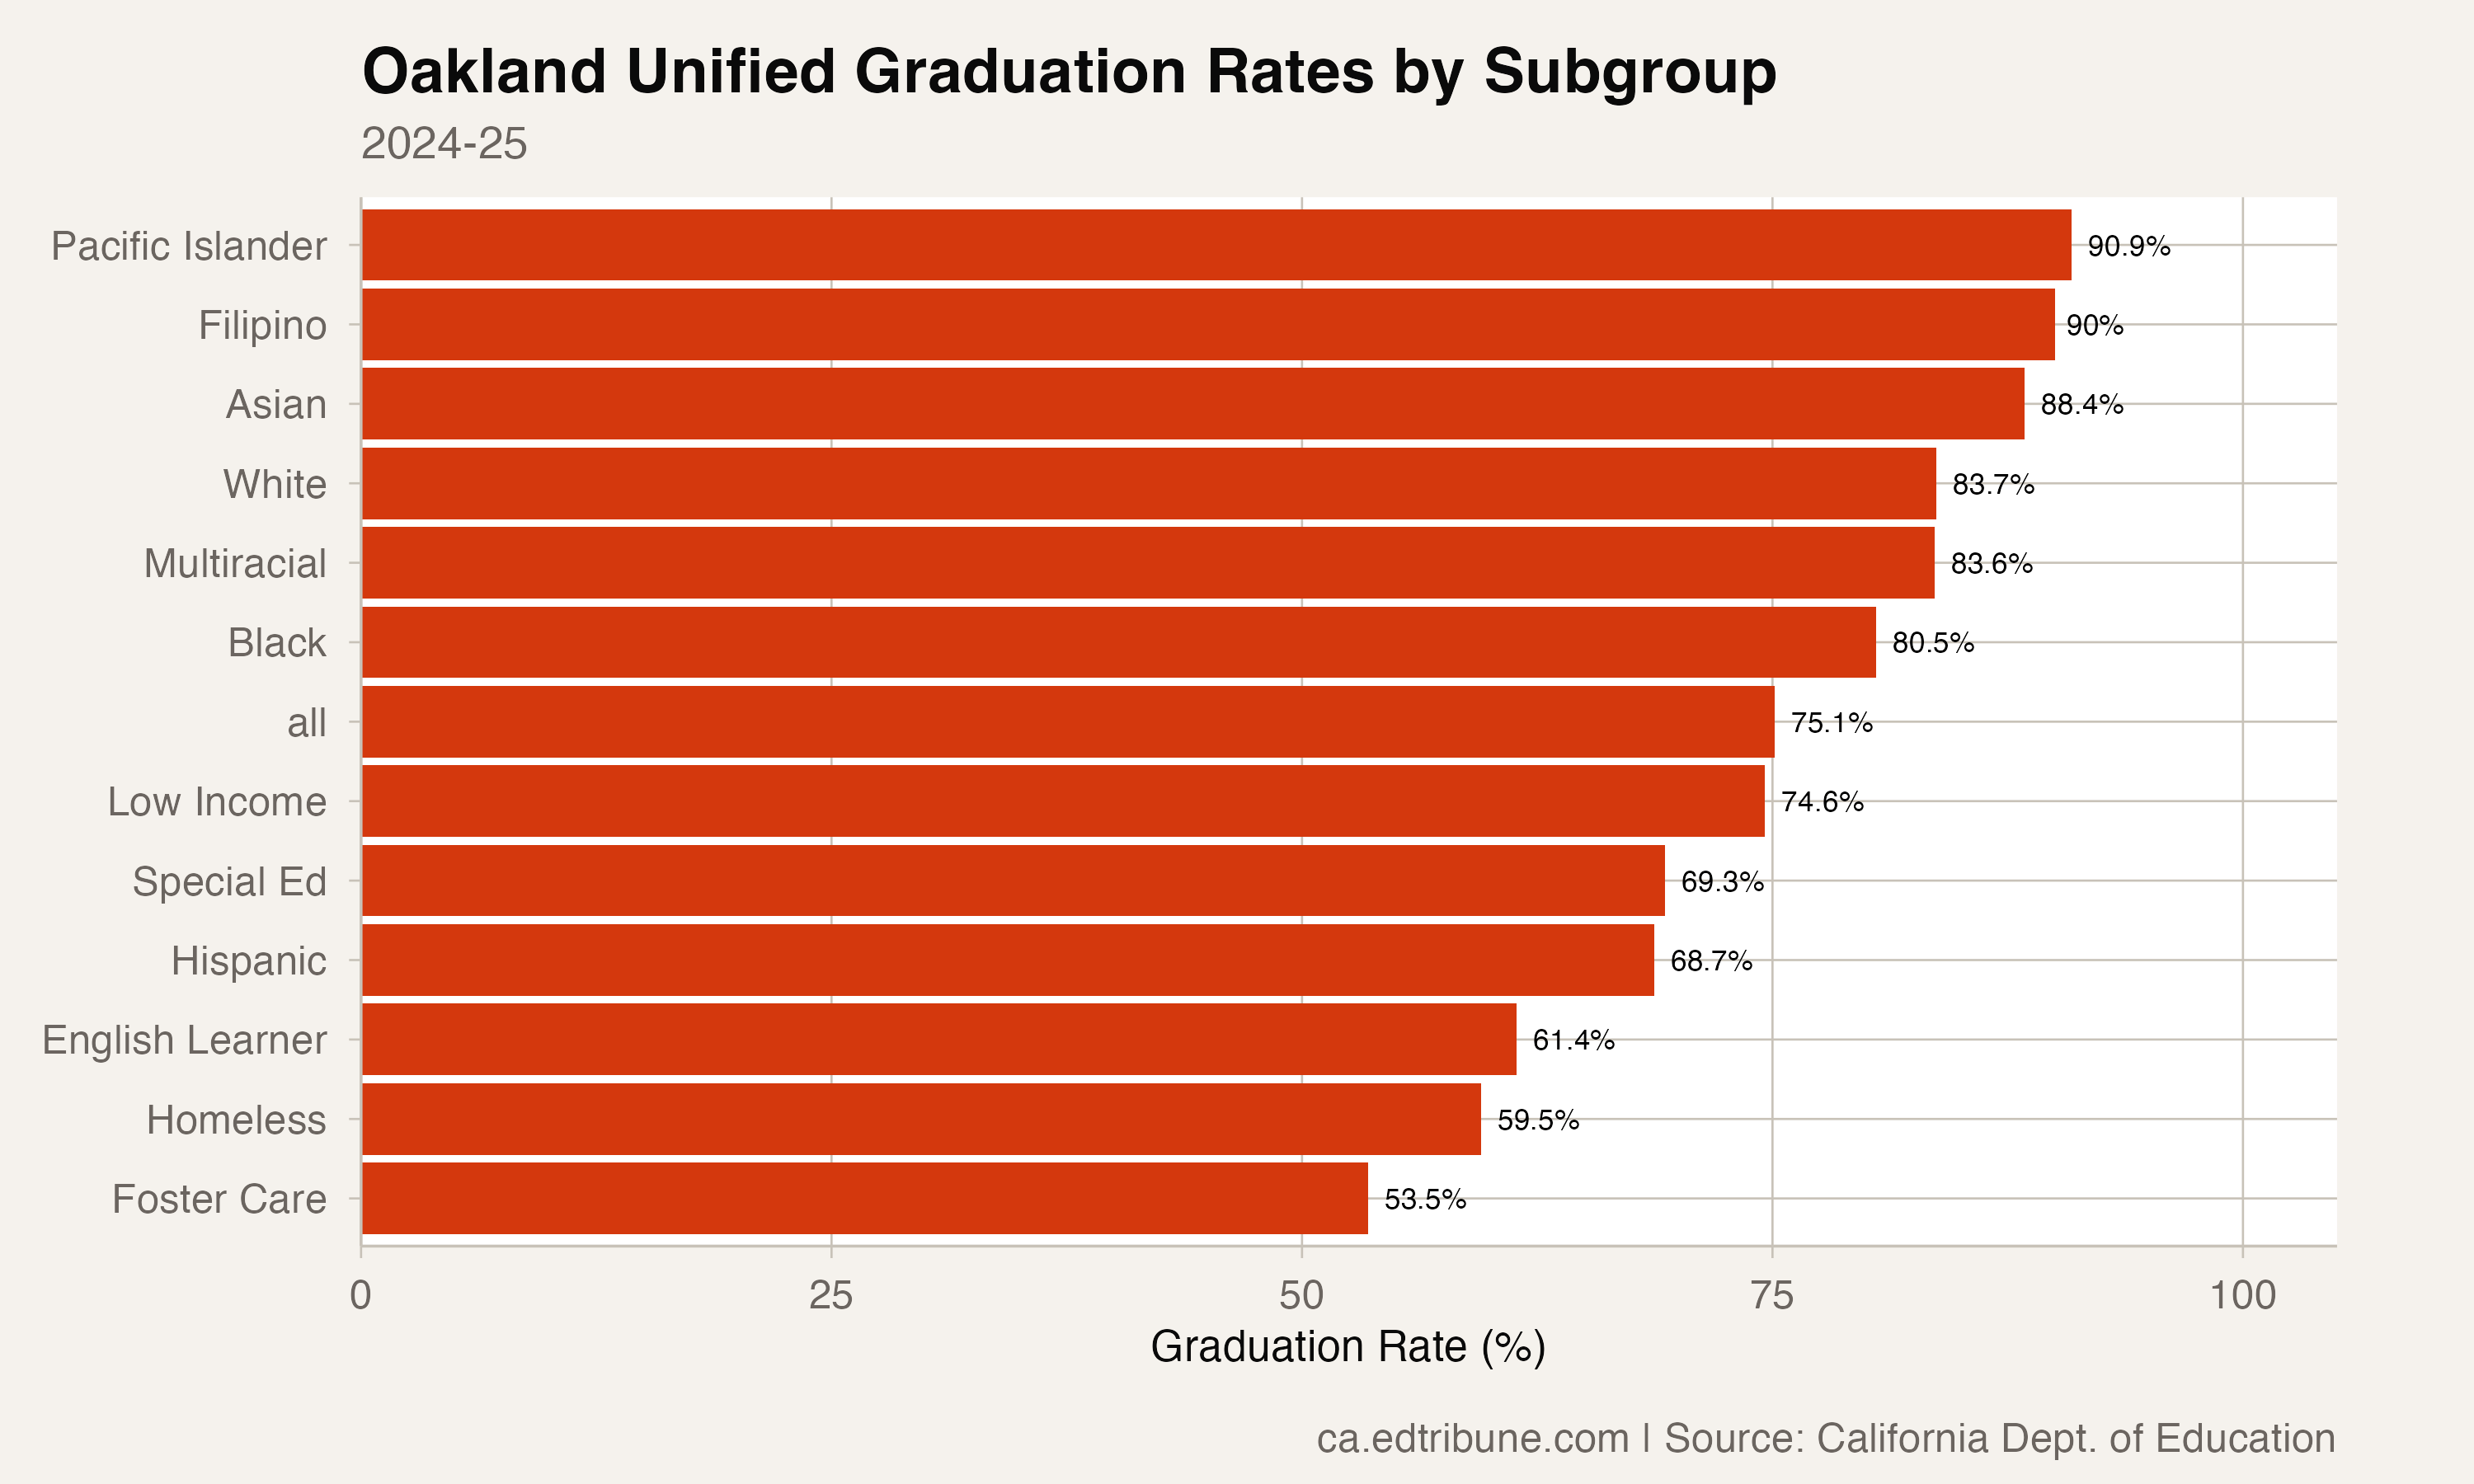
Hispanic students, who make up the majority of Oakland's cohort, graduate at 68.7% -- more than 18 points below the state average for Hispanic students (86.9%). English learners fare worse still at 61.4%, a rate nearly 18 points below the state EL average.
Black students at 80.5% and white students at 83.7% perform closer to their statewide peers but still lag. Asian students at 88.4% are the one group near the state average.
The Diverging Paths
Oakland's trajectory has diverged from the state's in a way that is new. In 2018, Oakland was 6.6 points below the state average. The gap narrowed to 6.1 points by 2024 as Oakland improved to 80.6%. Then the 2025 collapse opened the gap to 12.7 points -- nearly double what it was seven years ago.
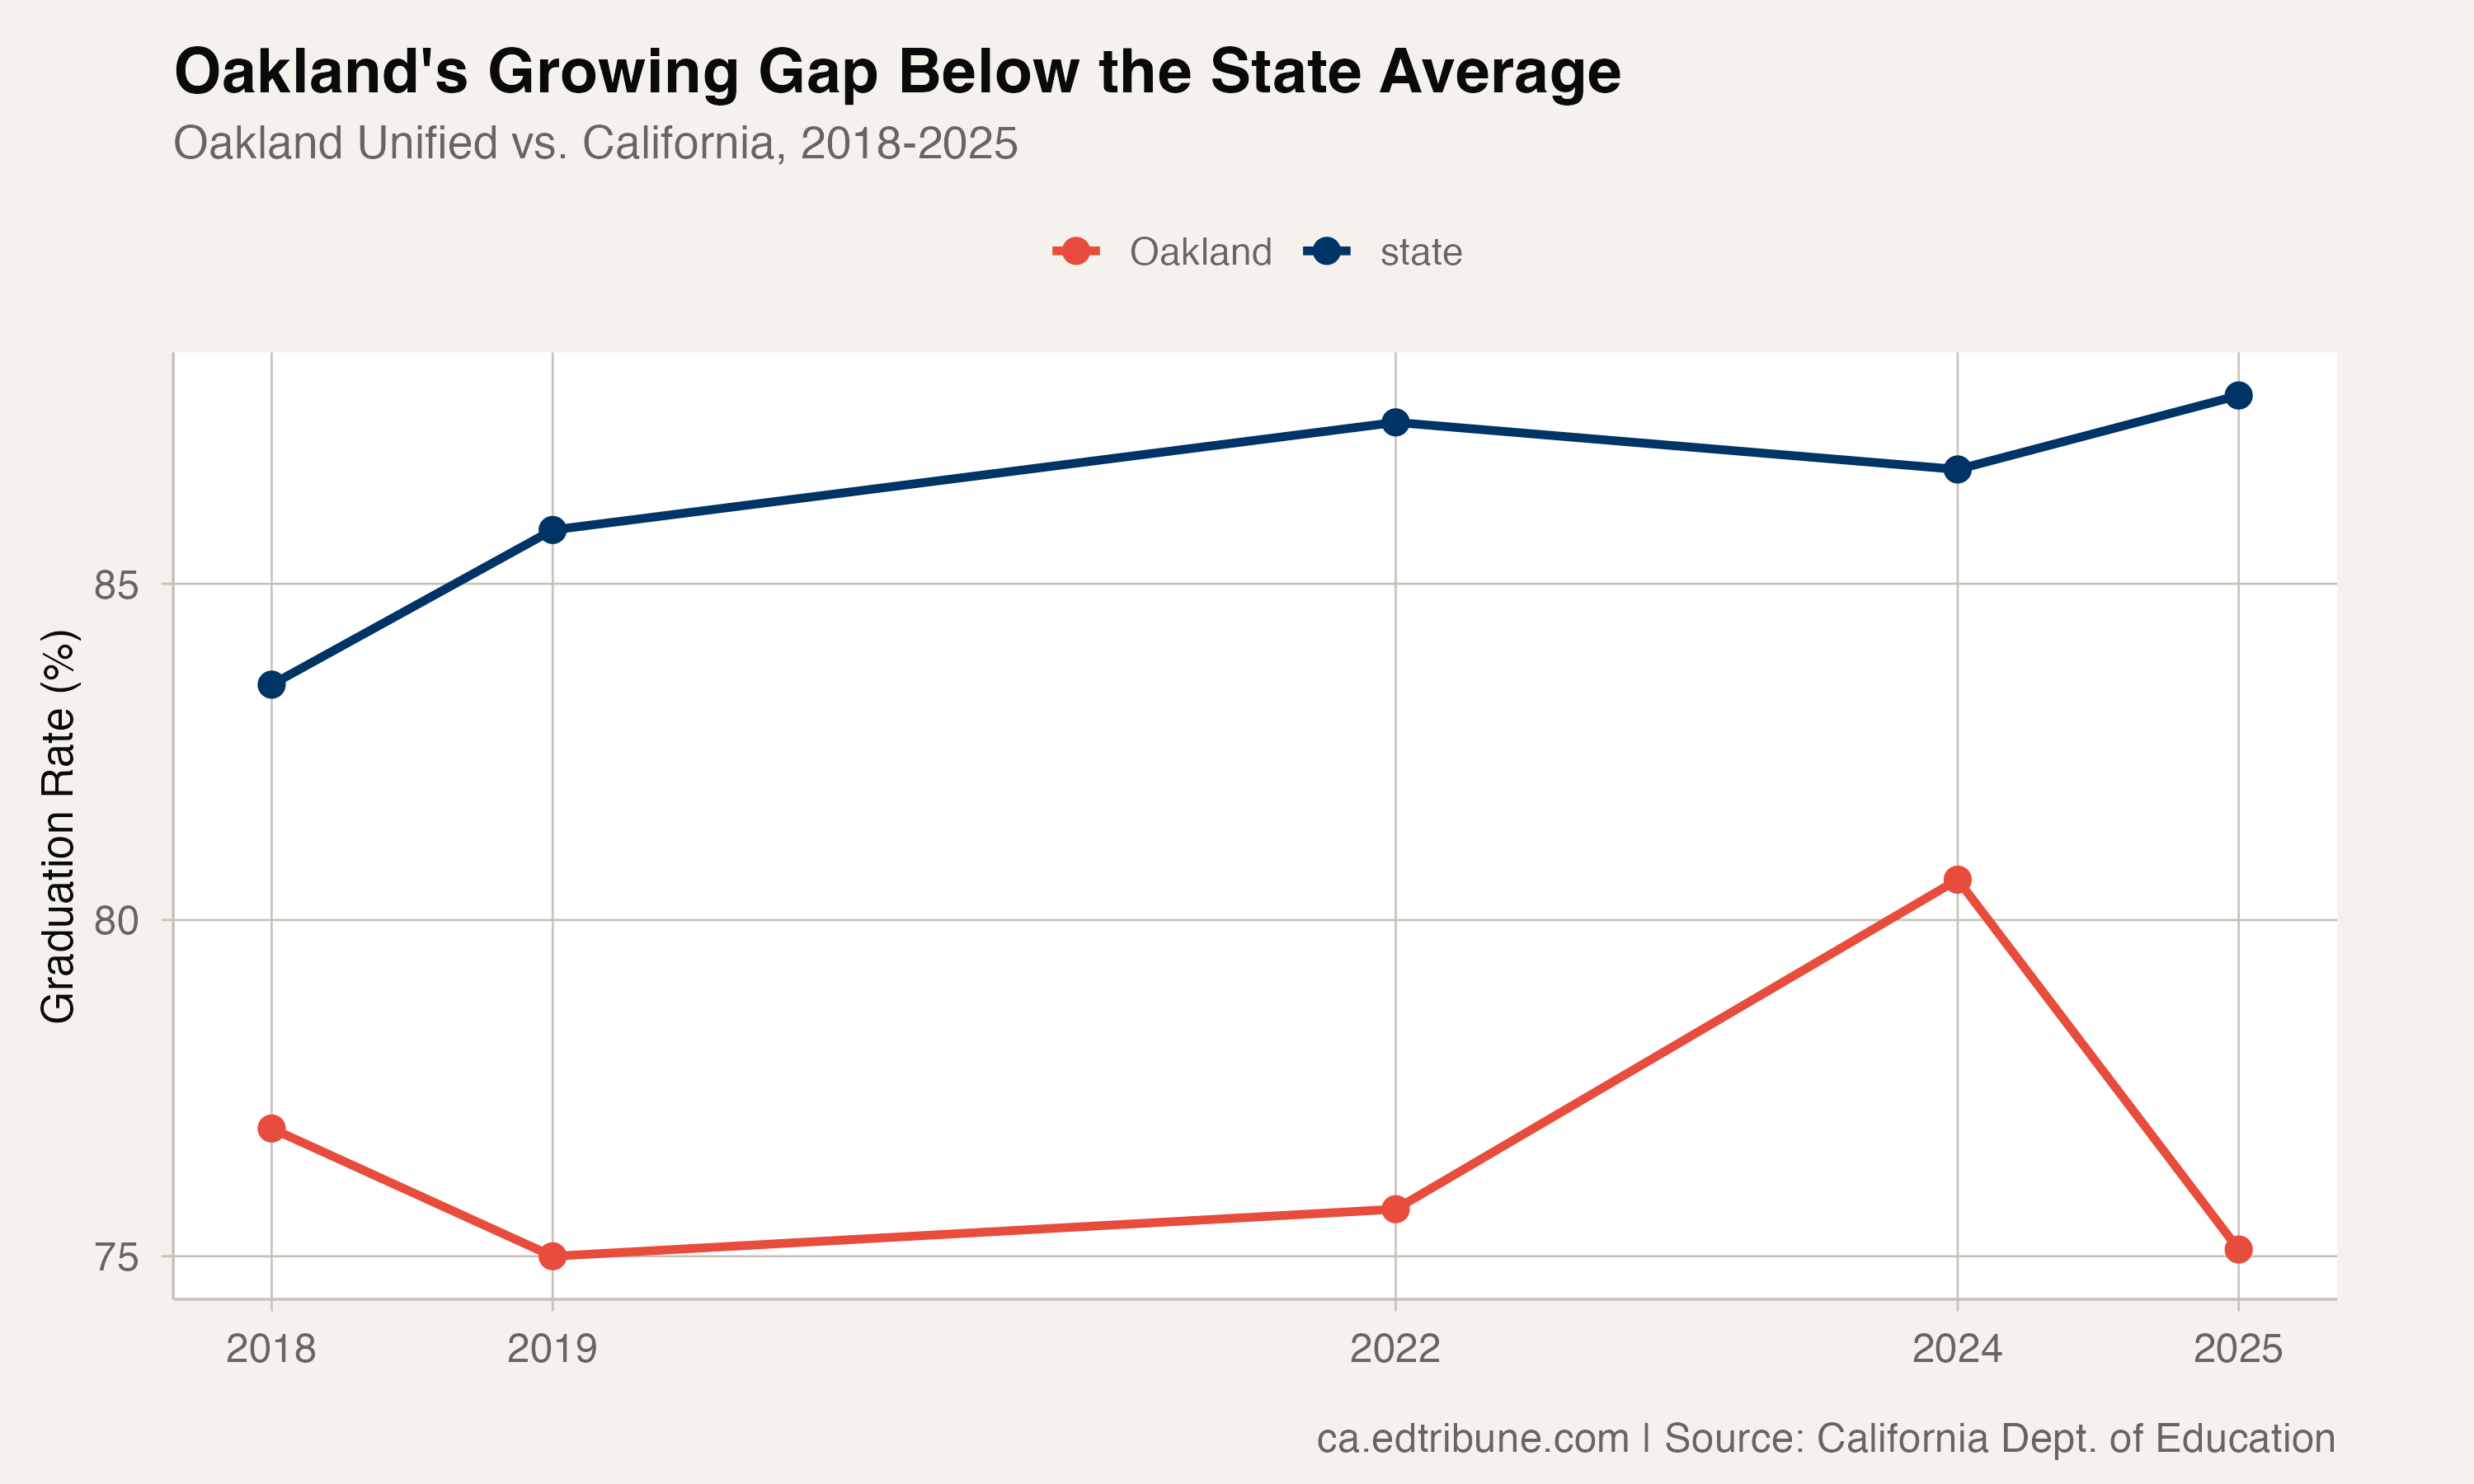
The timing is no coincidence. Oakland Unified has spent the past several years in a cycle of fiscal crisis, school closure fights, superintendent turnover, and enrollment decline. The district has lost roughly a third of its enrollment since 2000. A $95 million budget deficit forced painful cuts to staff and programs. Multiple rounds of school closures -- fiercely contested by communities -- disrupted student pathways.
Whether these disruptions caused the graduation rate decline or merely coincided with it, the data cannot say with certainty. But the magnitude of the drop, 5.5 points in a year when the state improved by 1.1 points, is difficult to attribute to demographics alone.
What It Means
A 75.1% graduation rate means that roughly 700 students in Oakland's 2025 cohort did not graduate. In a district where students who are currently homeless number 573 and English learners number 1,086, the non-graduates are concentrated among the most vulnerable.
Oakland is a city that prides itself on social justice values. Its school district has the lowest graduation rate of any large urban system in the state, and the gap is widening.
Detailed code that reproduces the analysis and figures in this article is available exclusively to EdTribune subscribers.
Discussion
Sign in to join the discussion.
Loading comments...