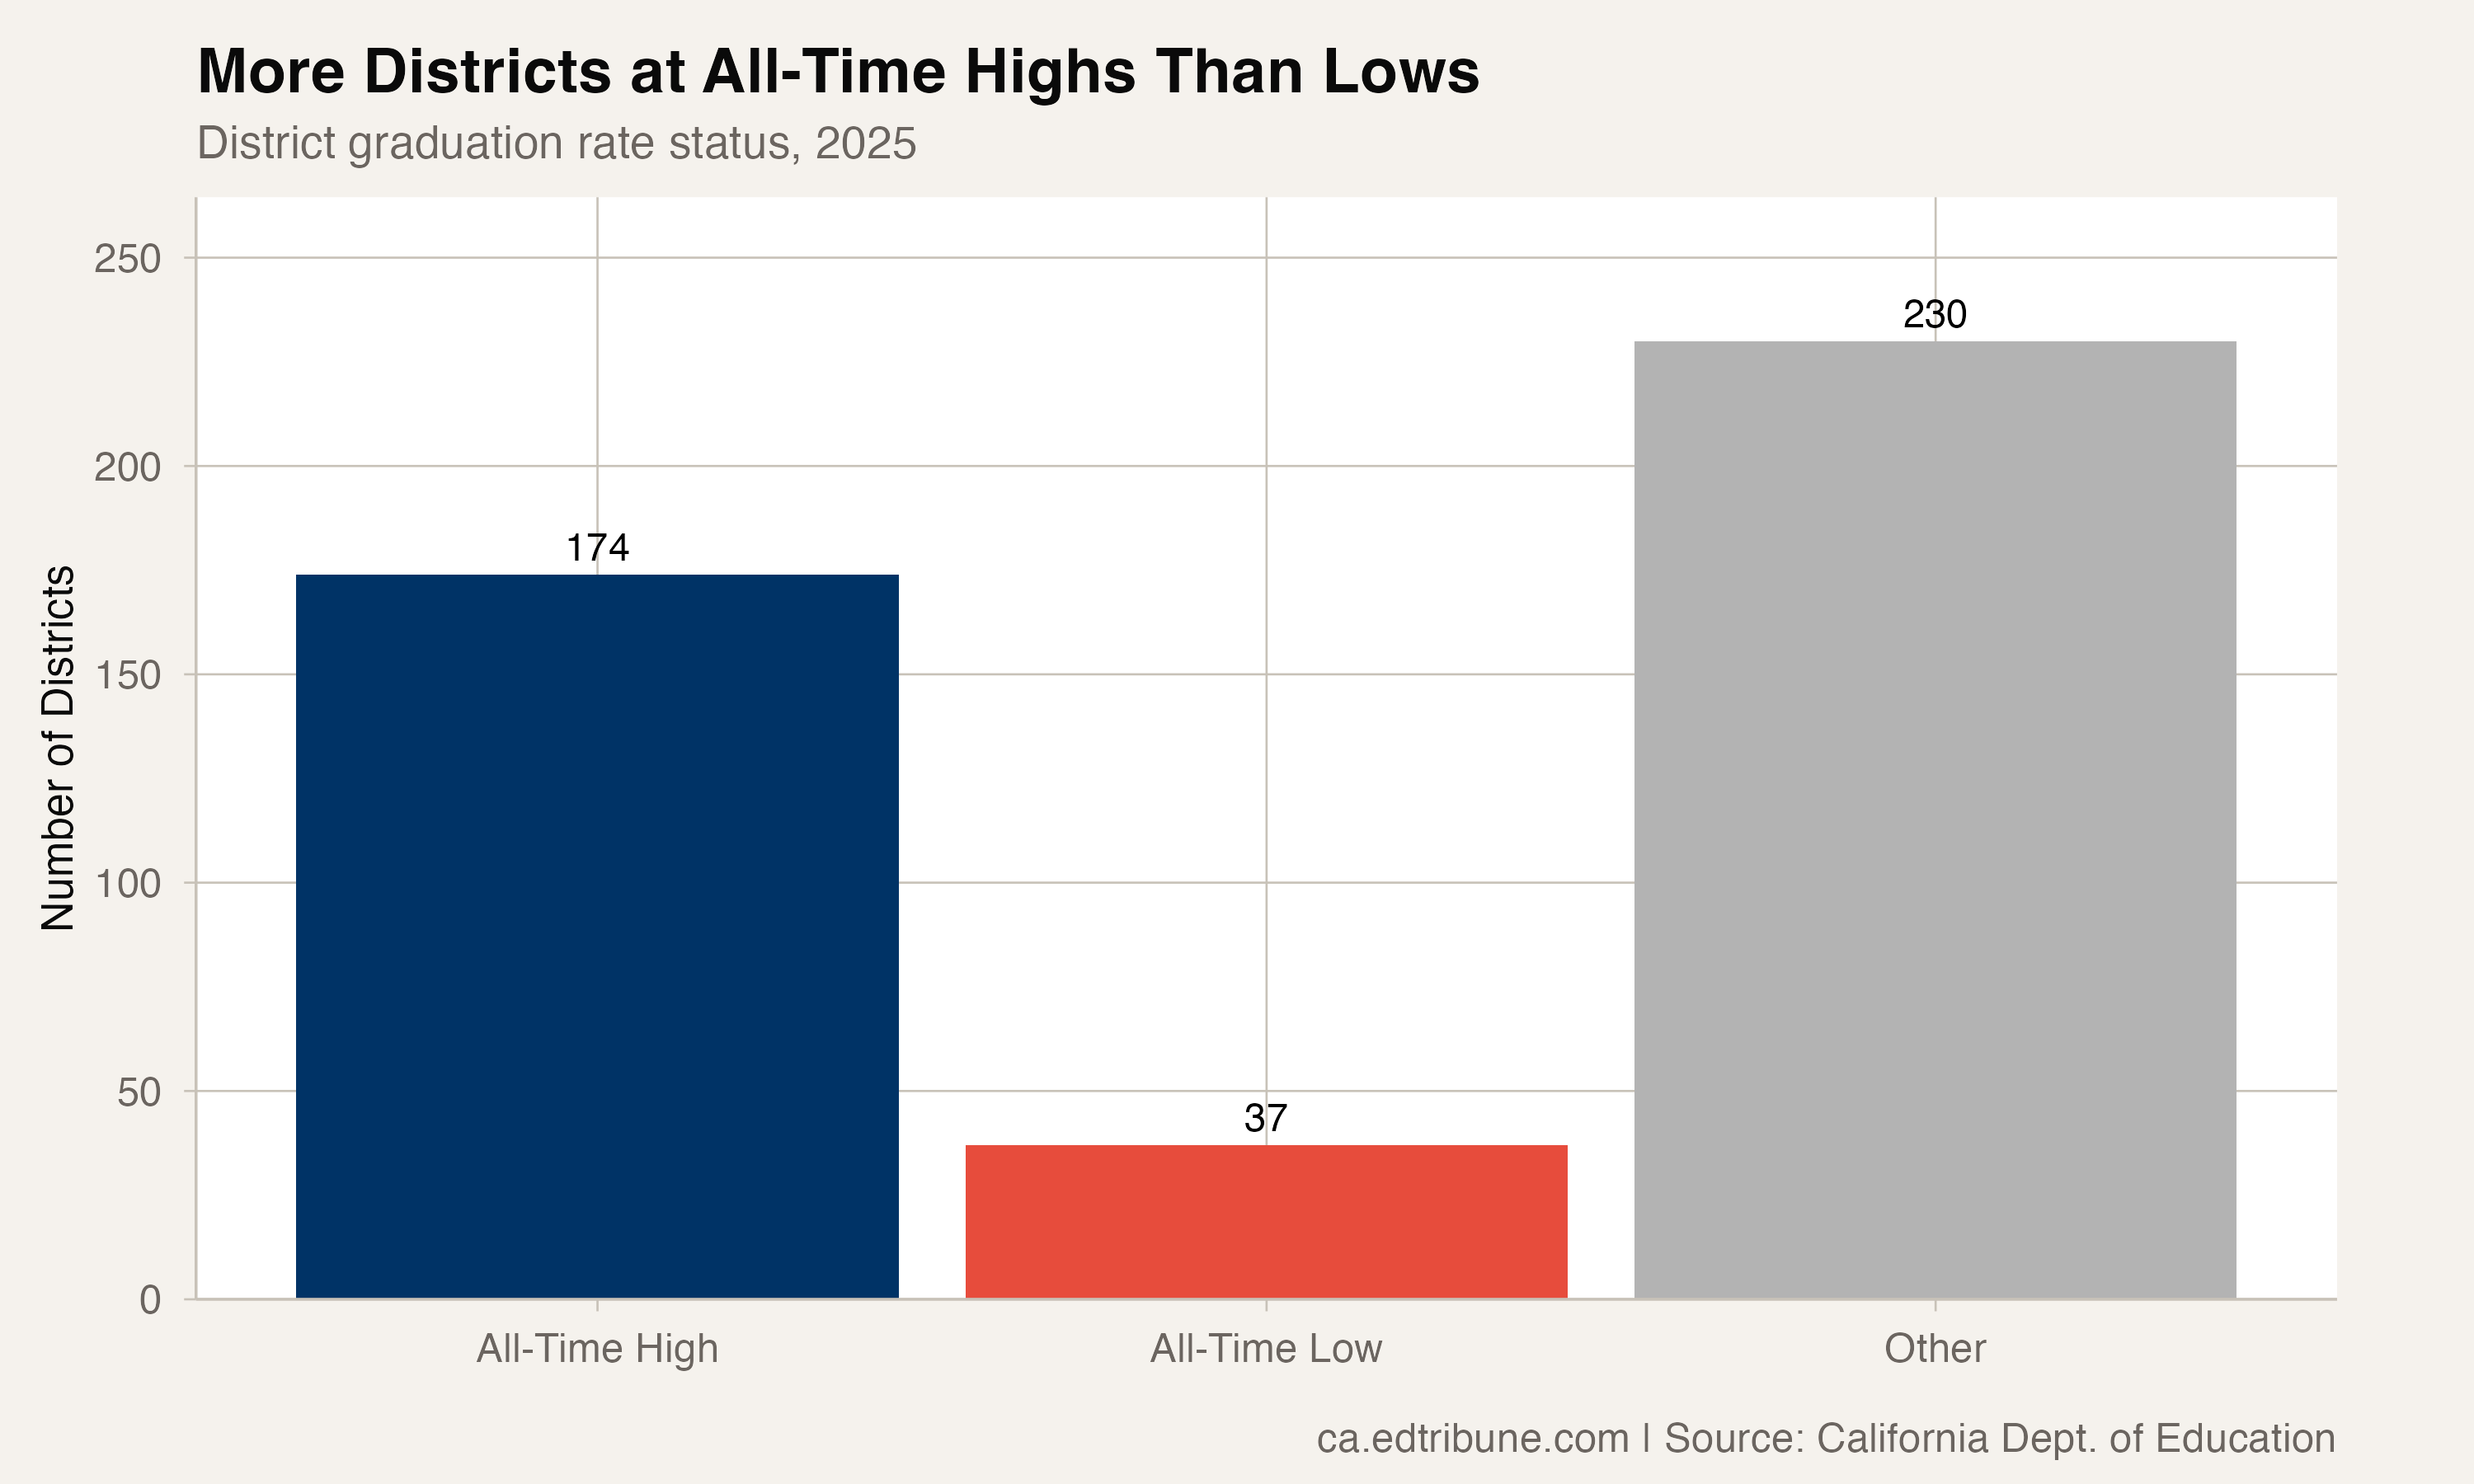
In 2025, 174 of California's 441 reporting districts recorded their highest graduation rate ever. That is nearly 40% of all districts hitting a ceiling they had never previously reached, in the same year.
The number is even more striking against its opposite: only 37 districts posted an all-time low. For every district at its worst, nearly five were at their best.
The Scale
This is not a story driven by tiny rural districts with 30-student cohorts. Among the districts at all-time highs are some of the state's largest:
- Sweetwater Union High↗ET: 91.5% (6,655 students)
- Chaffey Joint Union High↗ET: 91.8% (5,530 students)
- Long Beach Unified↗ET: 87.4% (5,303 students)
- Anaheim Union High↗ET: 94.4% (4,846 students)
- Fresno Unified↗ET: 90.8% (4,430 students)
- San Bernardino City Unified↗ET: 93.5% (3,220 students)
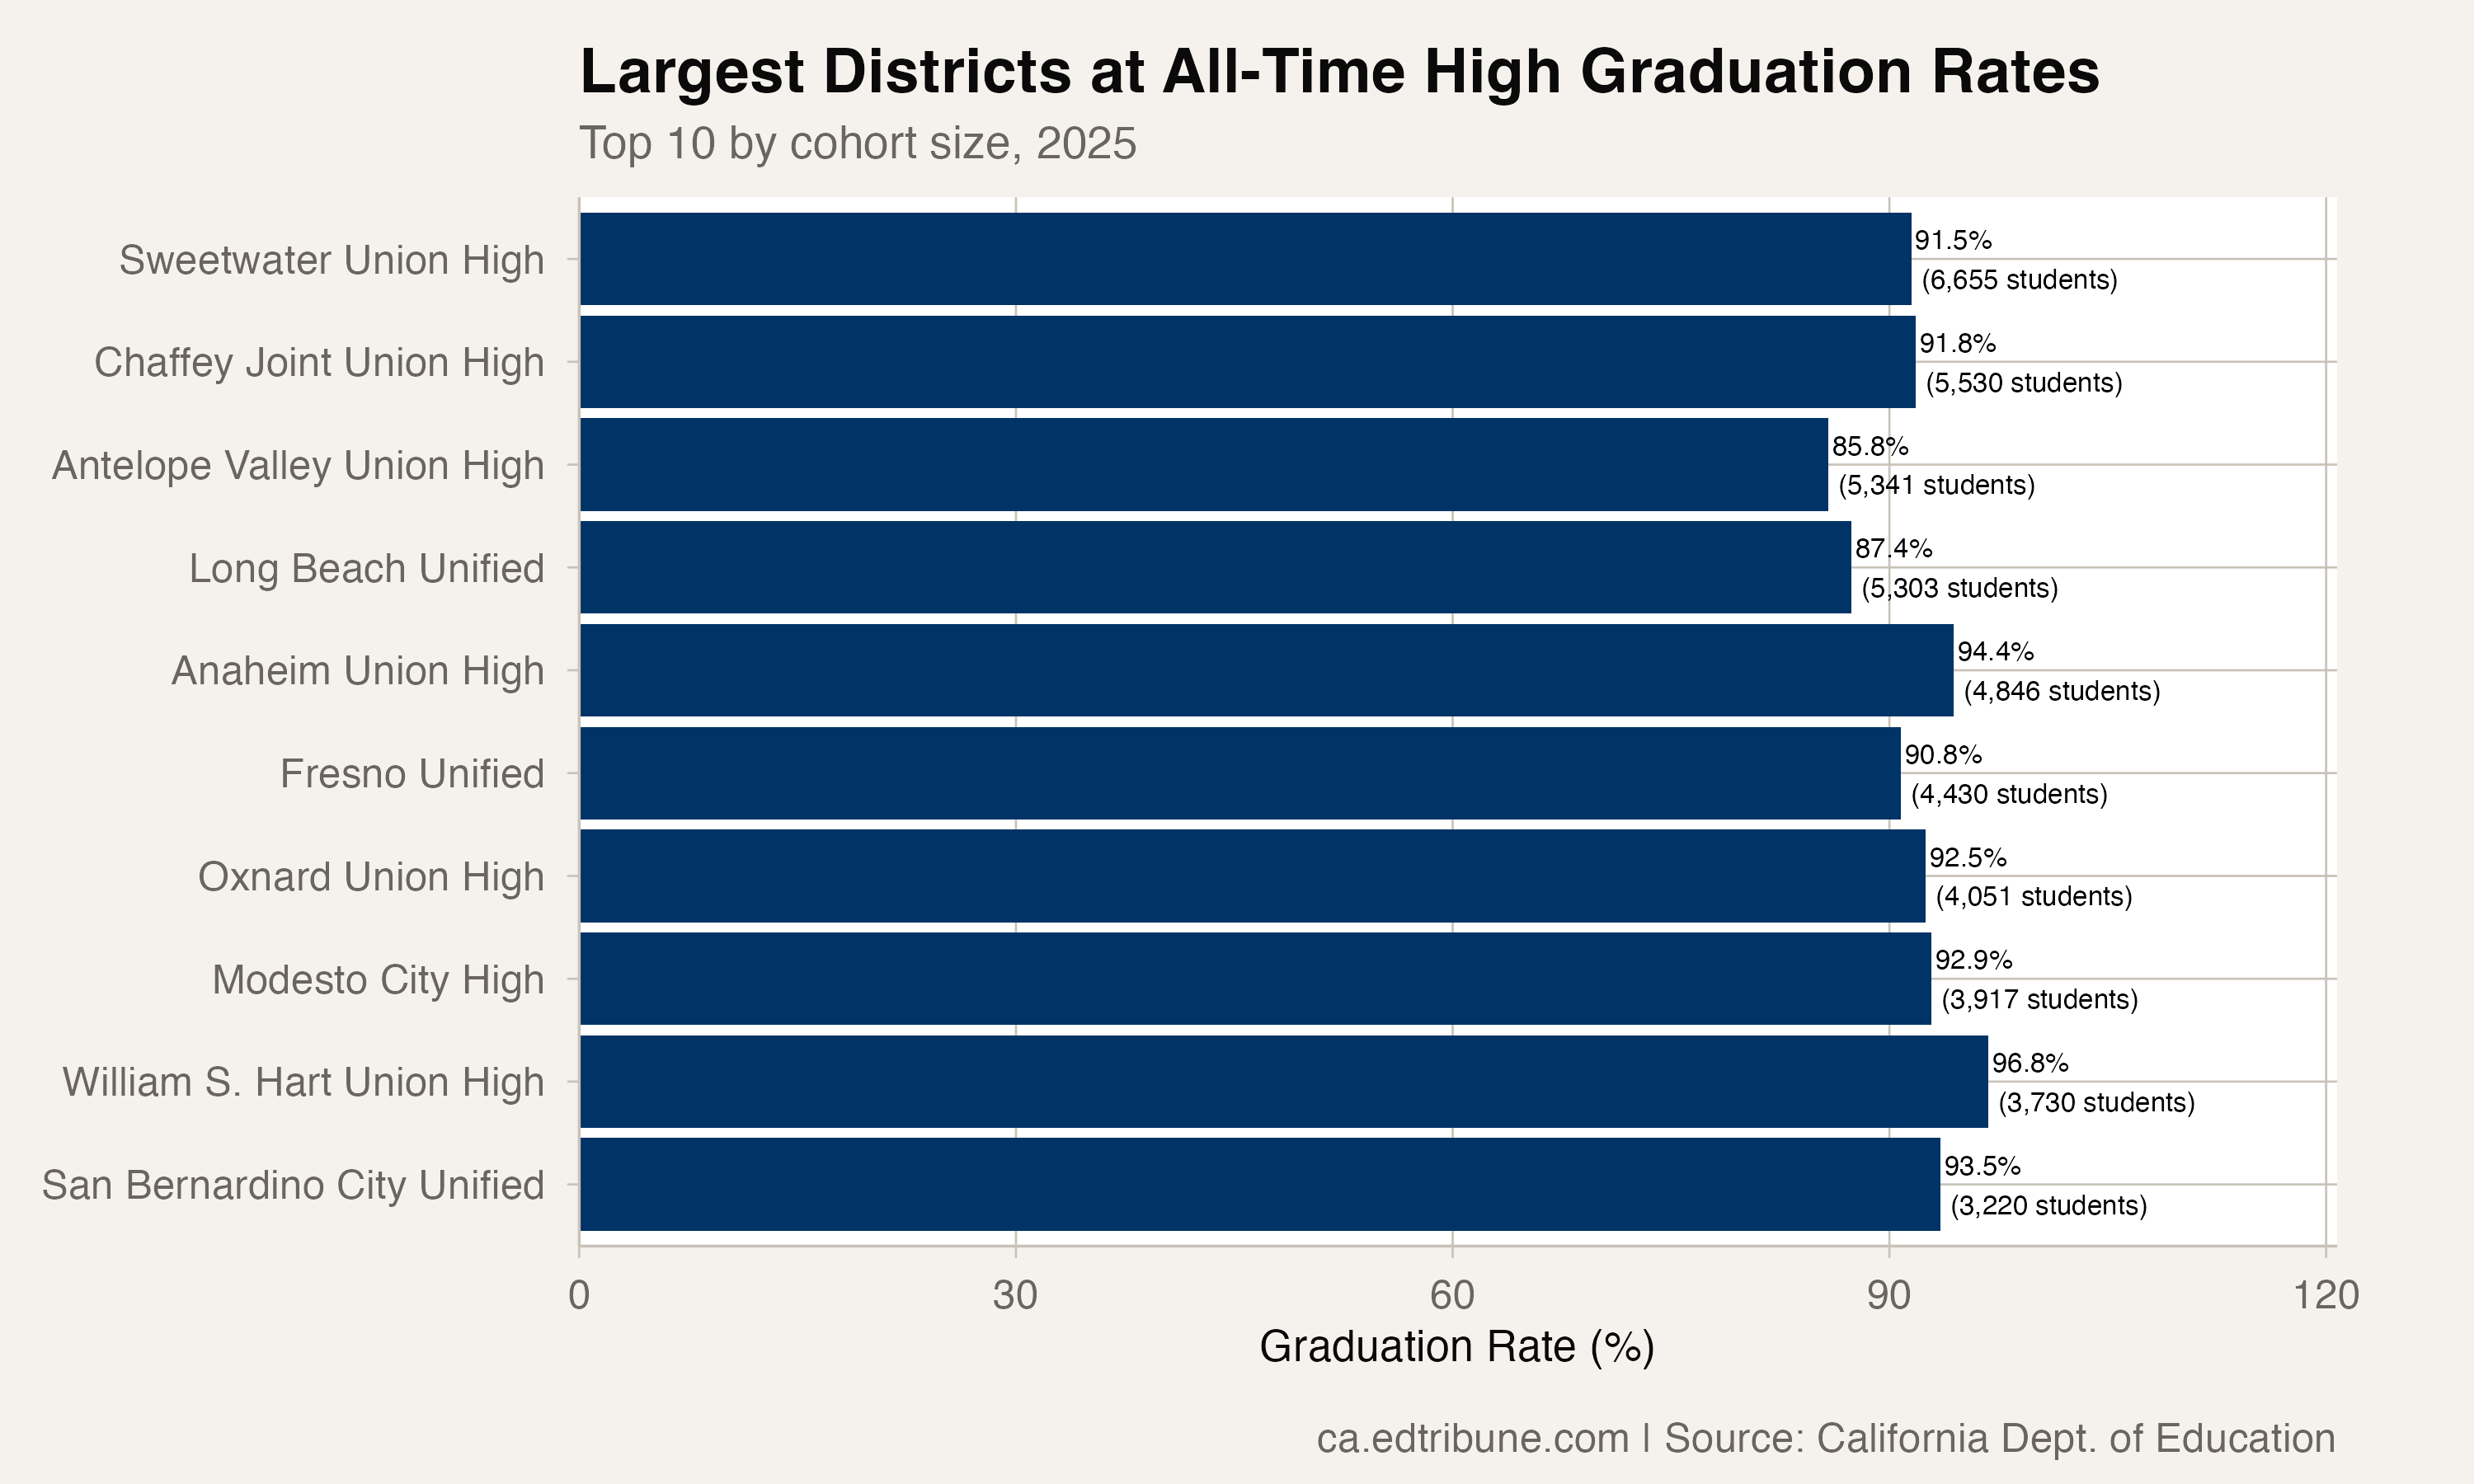
These are not affluent enclaves. Sweetwater sits along the U.S.-Mexico border. Chaffey serves the Inland Empire. San Bernardino City is one of the highest-poverty large districts in Southern California. Fresno anchors the Central Valley. The all-time-high club cuts across geography, demographics, and economics.
The Distribution
The median California district graduated at 93.2% in 2025. That means half of all districts are already above 93%.
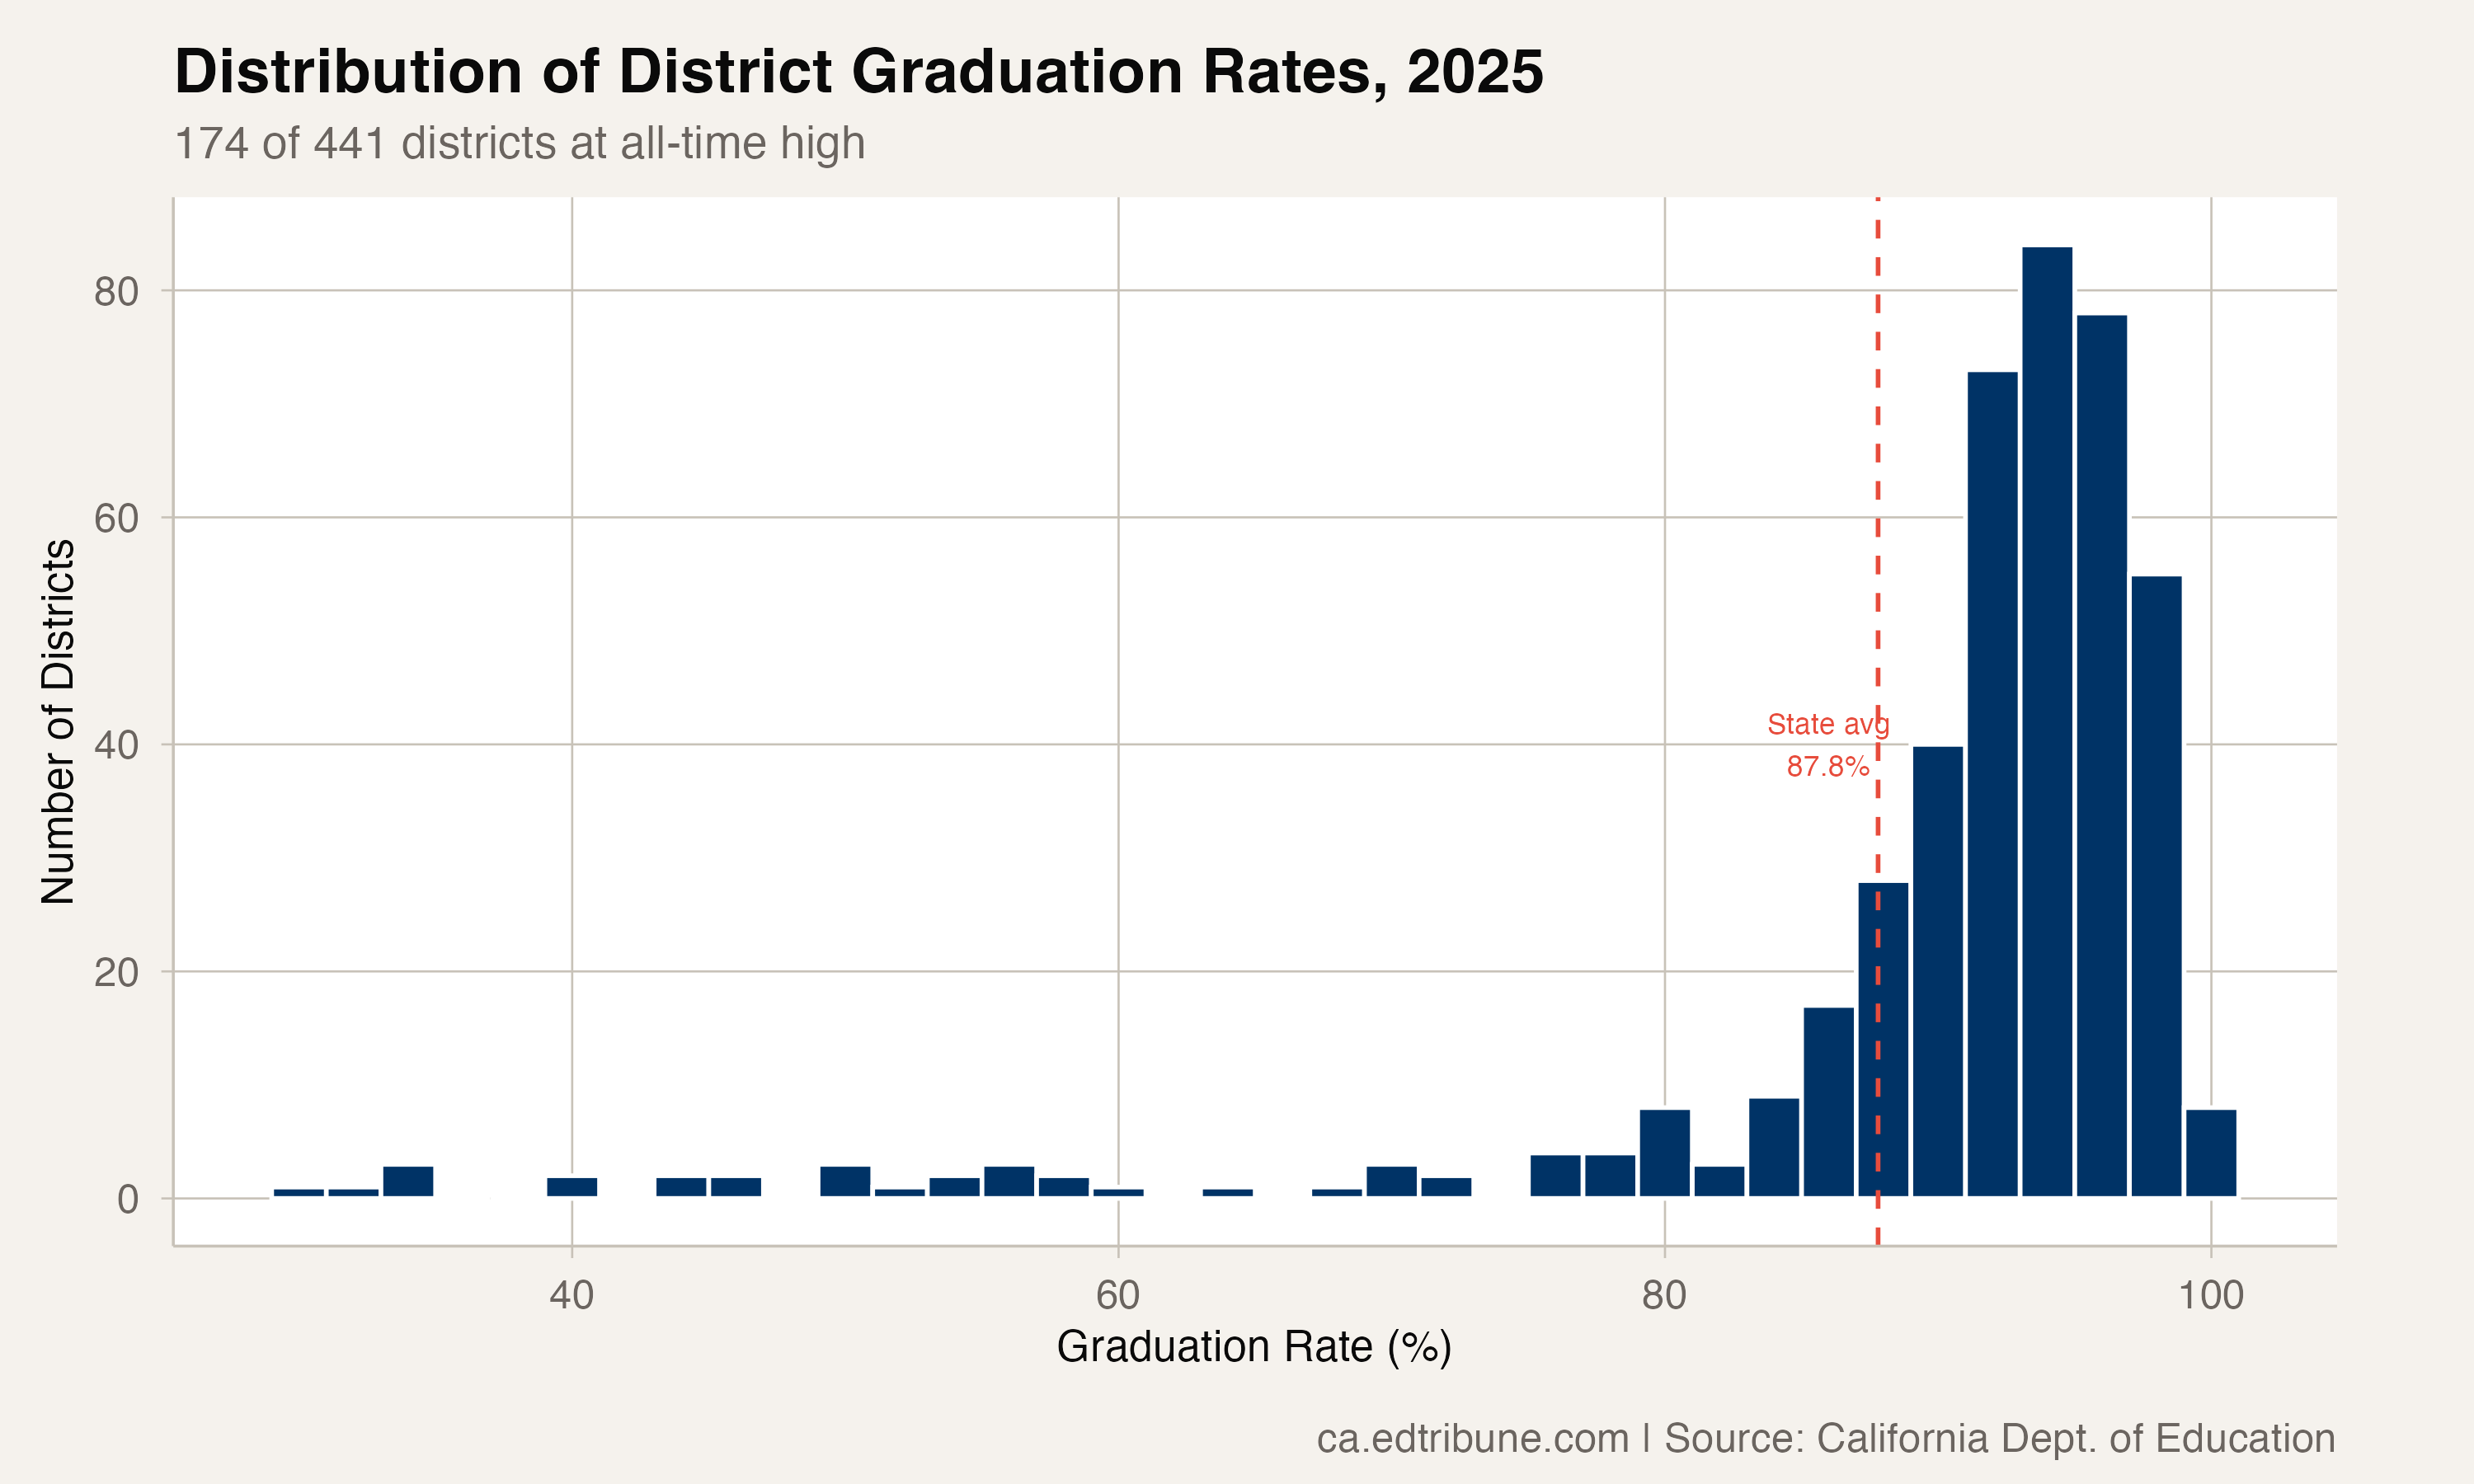
The distribution is heavily left-skewed: most districts cluster above 85%, with a long tail stretching down below 70% that consists almost entirely of County Offices of Education (which serve at-risk populations like juvenile hall and continuation school students, making direct comparisons misleading).
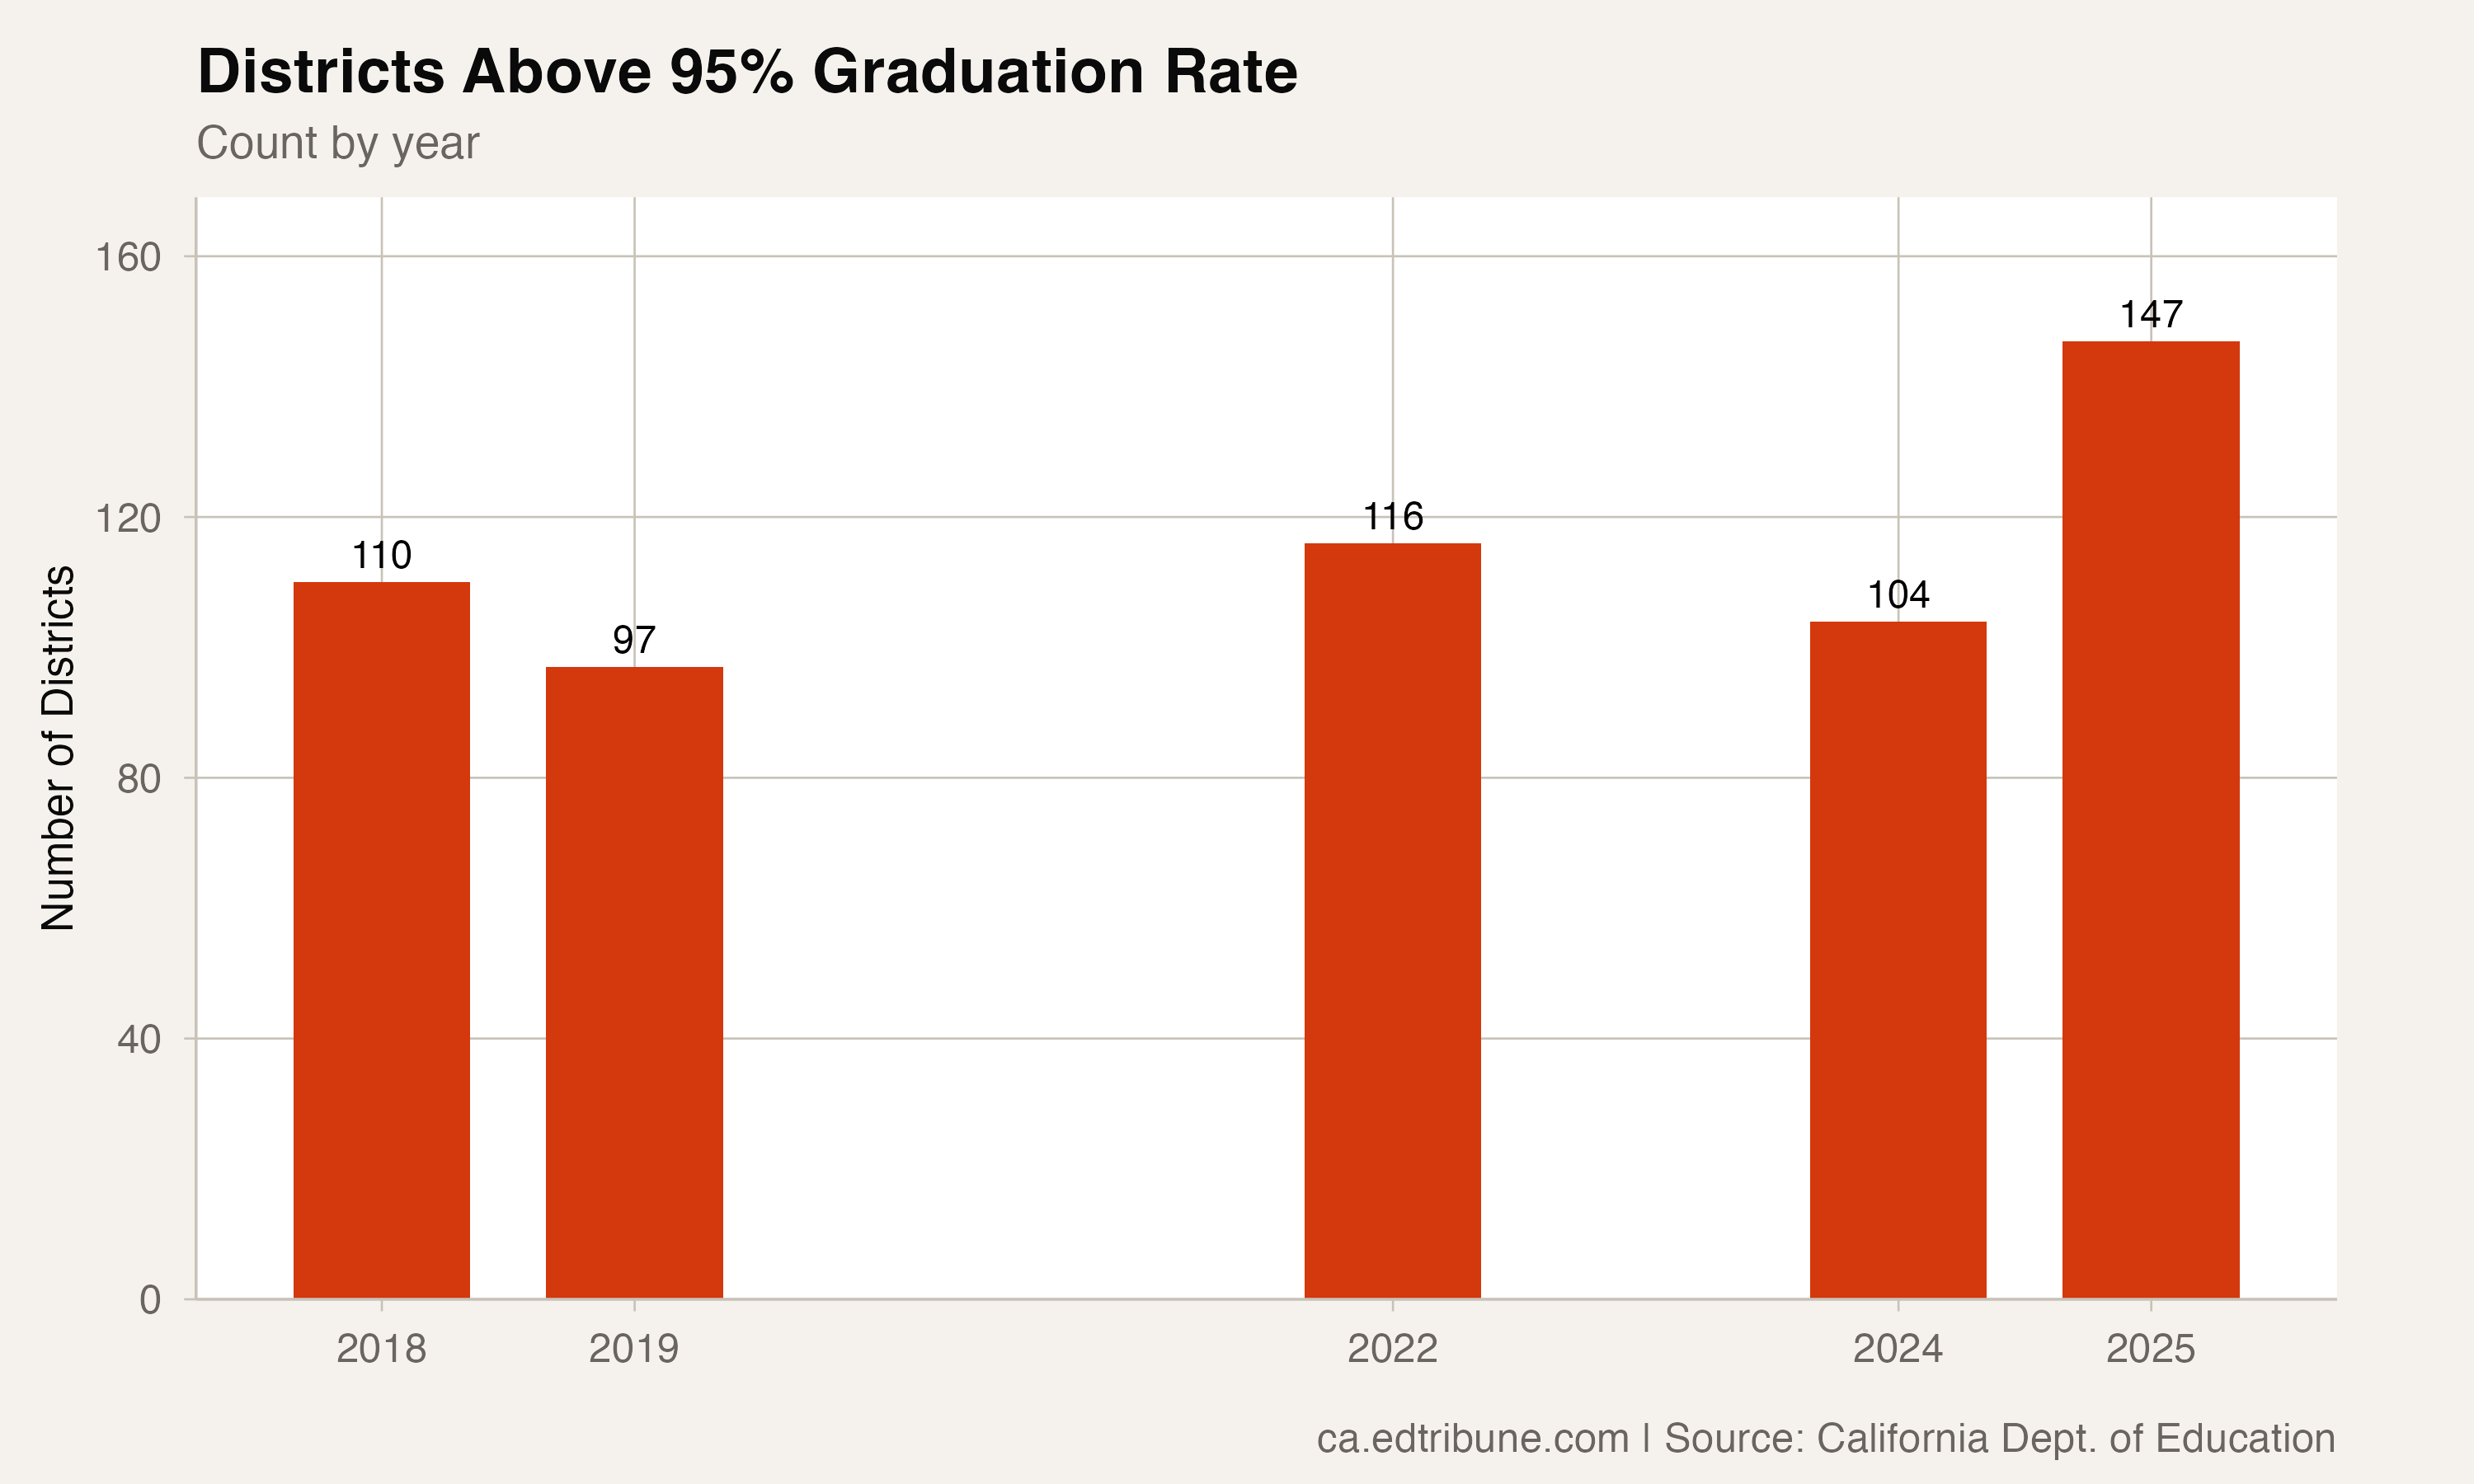
The count of districts at or above 95% has been climbing too: from 110 in 2018 to 147 in 2025. California is reaching a point where a 95% graduation rate is typical rather than exceptional.
What It Means
A district hitting an all-time high is not guaranteed to stay there. The 2024 data showed that statewide rates dipped after a post-COVID peak in 2022, suggesting that some pandemic-era flexibility may have temporarily inflated numbers. The 2025 recovery, with 69% of districts improving year over year, makes the case that the underlying trend is real.
Still, "all-time high" in a data window of five years (2018, 2019, 2022, 2024, 2025) carries a caveat. California waived graduation reporting during 2020 and 2021, and the 2023 data is not in the current release. The records are being set against a limited baseline. A district that was at 94% in 2019, dipped to 91% in 2024, and rebounded to 94.5% in 2025 is technically at an all-time high, but the gain over seven years is modest.
The 37 districts at all-time lows deserve attention too. They include some County Offices of Education, but also traditional districts -- often small, rural, and under-resourced -- where the rising tide has not arrived.
The dominant story, though, is breadth. When four in ten districts are at their best-ever mark in the same year, and when those districts span the state's geography and demographics, the improvement is not random. Something systemic is working. Whether it is sustainable depends on whether the structural investments that coincided with the gains -- the Local Control Funding Formula, community schools, extended learning -- continue.
Detailed code that reproduces the analysis and figures in this article is available exclusively to EdTribune subscribers.
Discussion
Sign in to join the discussion.
Loading comments...