Correction: An earlier version of this article stated that Pittsburg Unified had 73 white students and Victor Valley Union High had 449 white students in the 2025 cohort. The white cohort counts are 40 and 99, respectively. The graduation rates and Black-white advantages are unchanged. The article has been updated.
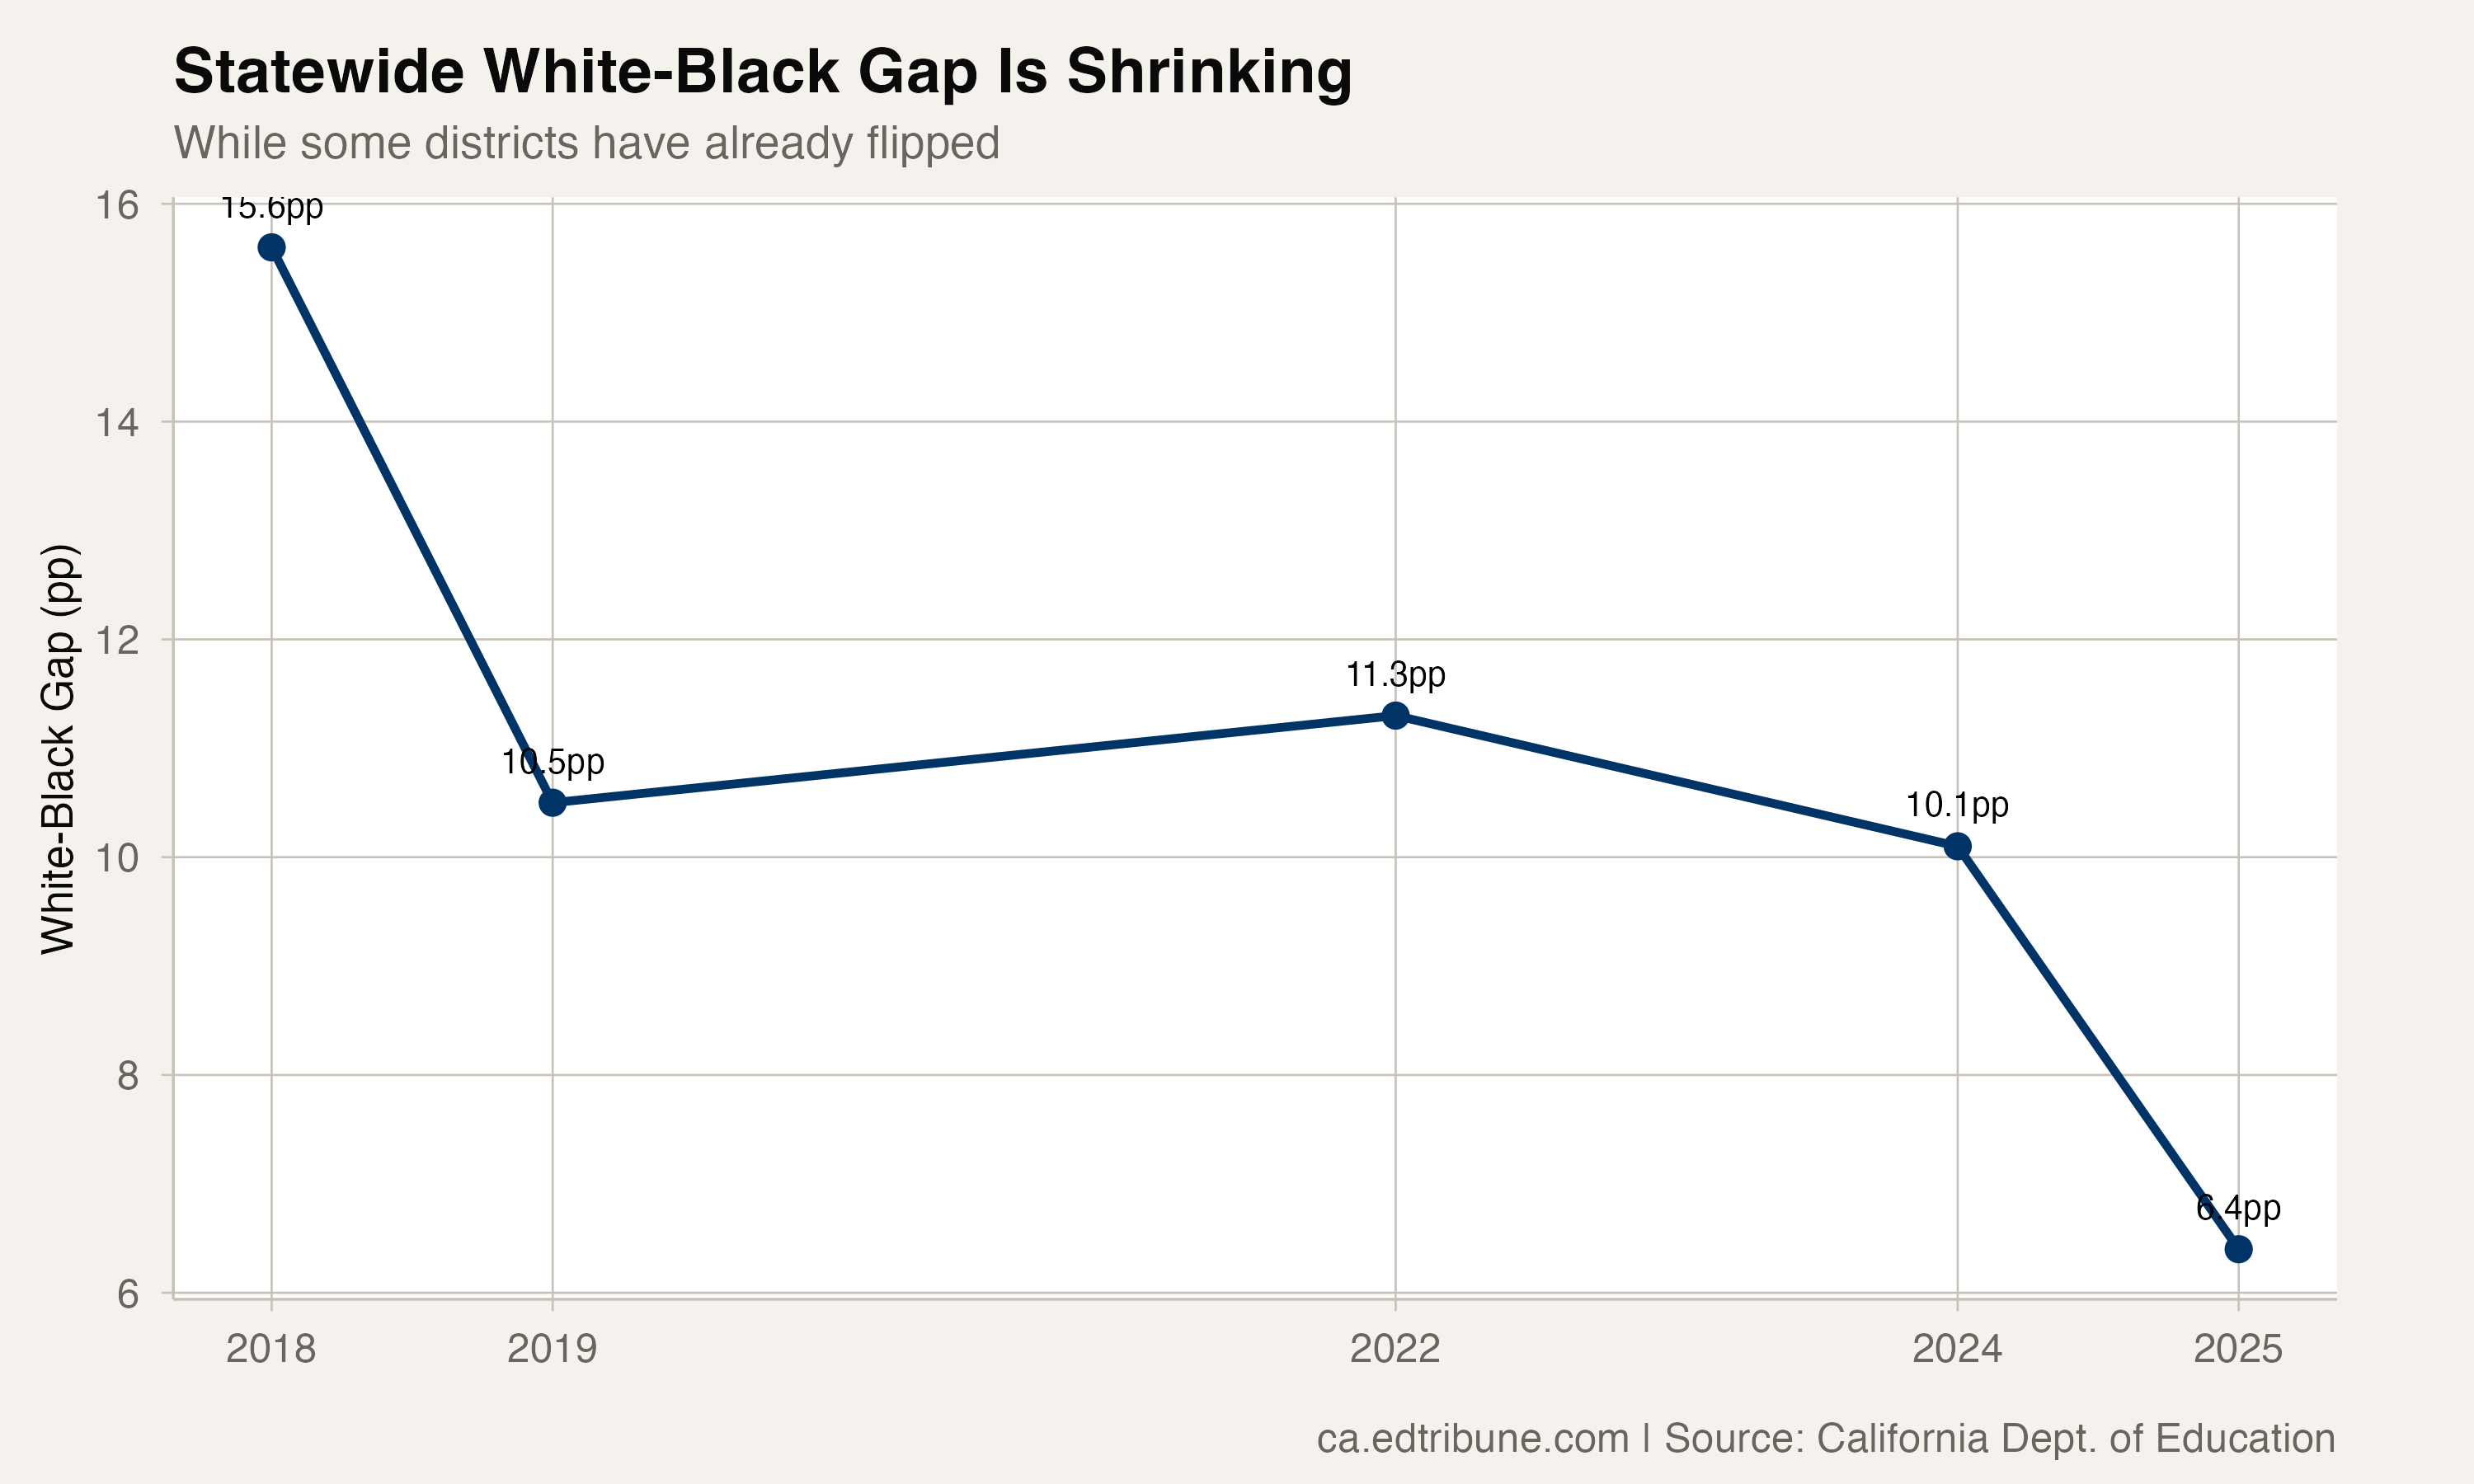
The default narrative about graduation rates goes like this: white students graduate at higher rates than Black students. In California, the statewide data confirms this -- 89.0% for white students, 82.6% for Black students, a gap of 6.4 percentage points.
But the statewide average obscures what happens at the district level. In 47 California districts where at least 30 Black students and 30 white students were in the 2025 cohort, Black students graduated at equal or higher rates than white students.
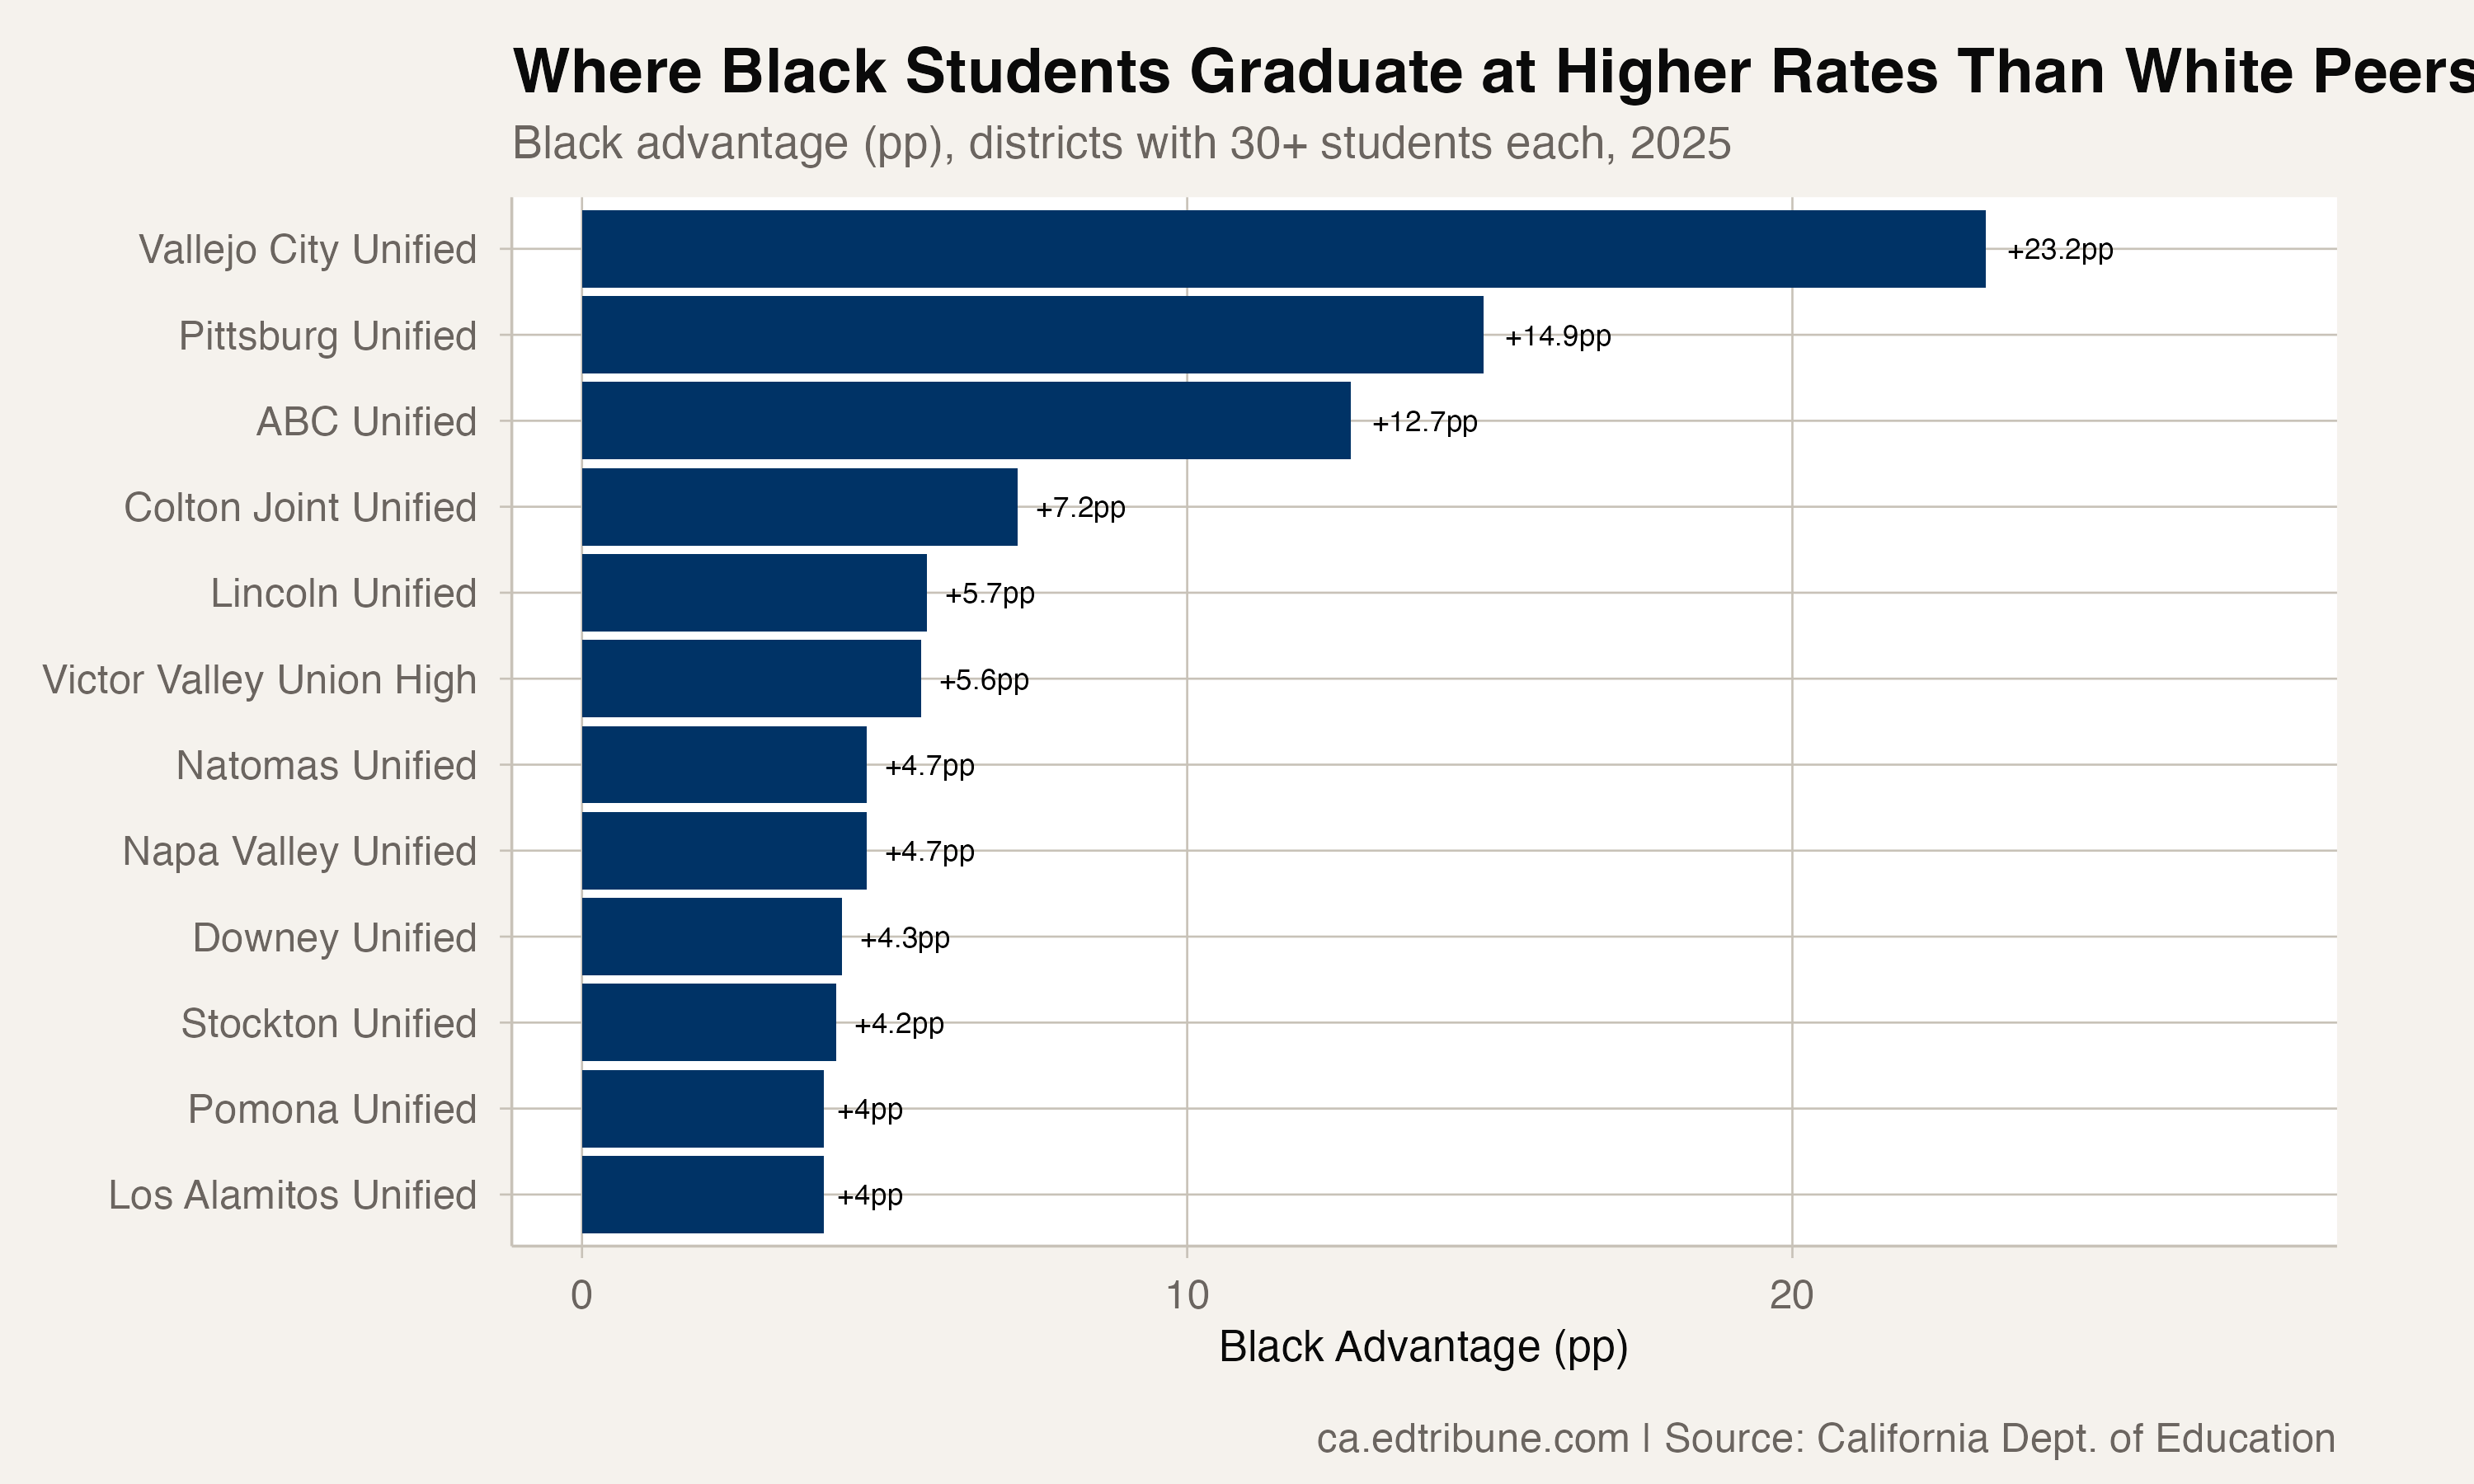
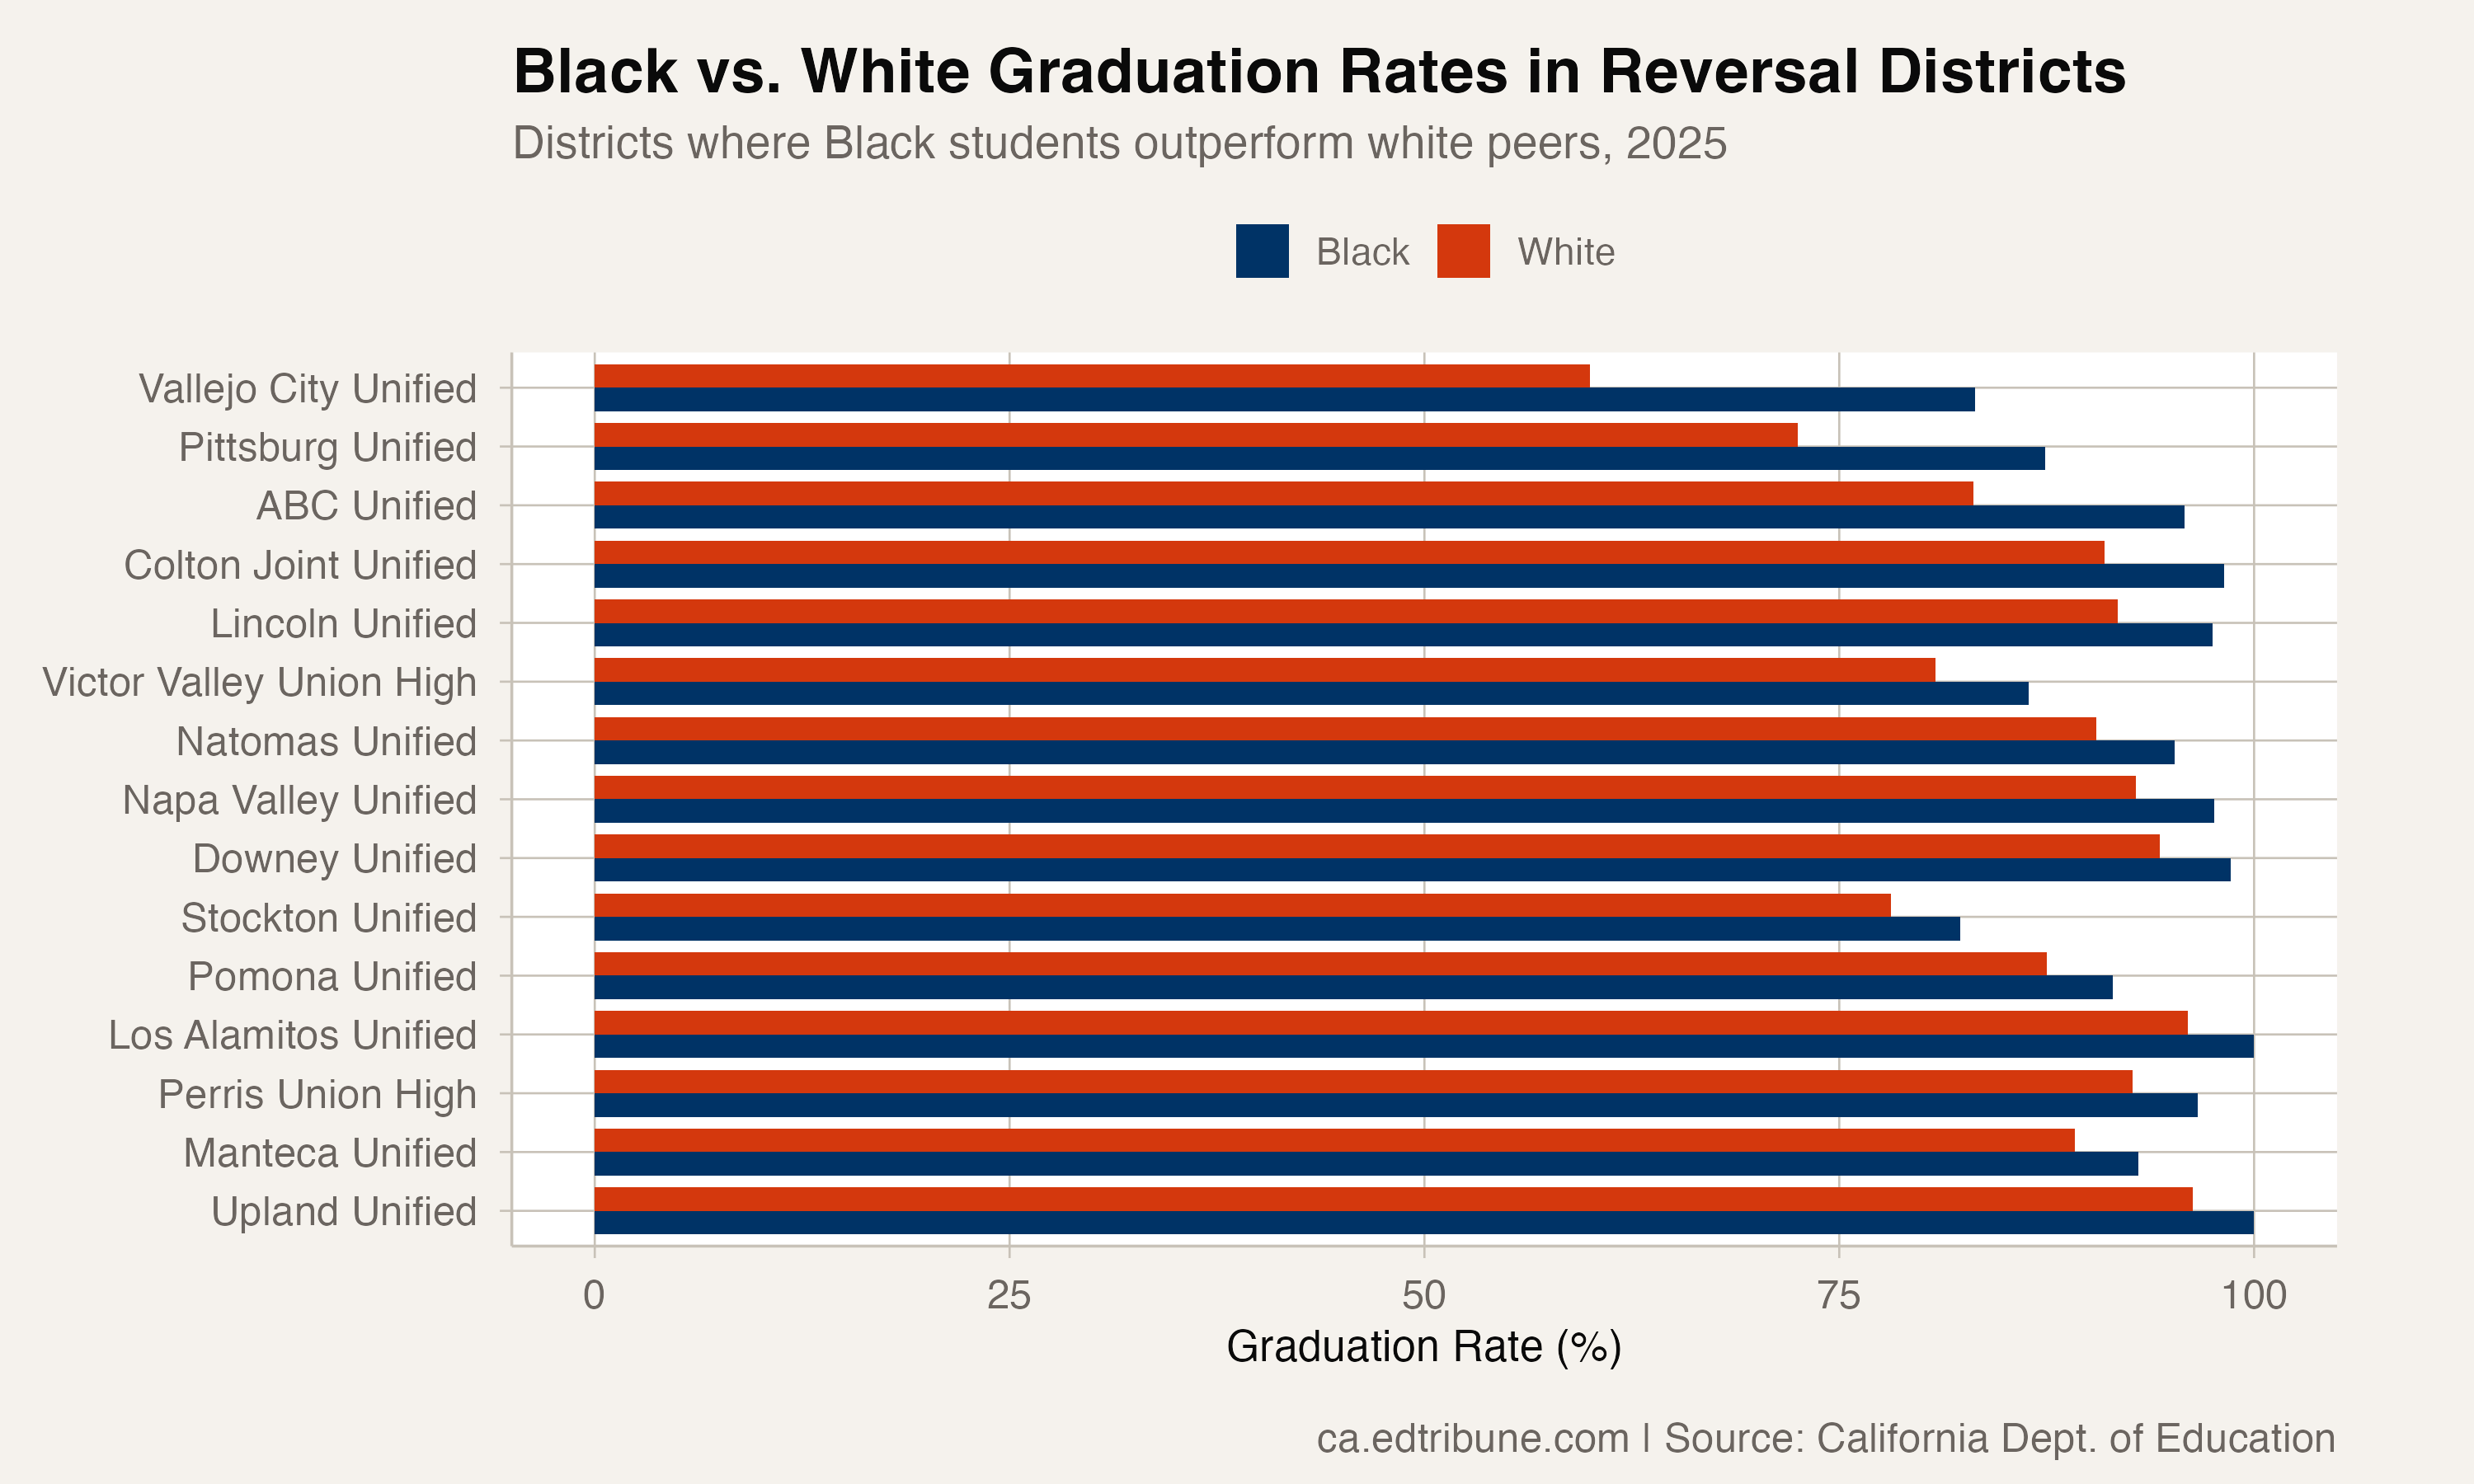
The reversals are not marginal. In Vallejo City Unified↗ET, Black students graduate at 83.2% while white students graduate at 60.0% -- a 23.2-point Black advantage. In Pittsburg Unified↗ET, the advantage is 14.9 points (87.4% vs. 72.5%). In ABC Unified↗ET, it is 12.7 points (95.8% vs. 83.1%).
The Numbers Behind the Reversals
These are not statistical flukes driven by tiny cohorts. Vallejo has 161 Black students and 50 white students in its cohort. Pittsburg has 190 Black students and 40 white students. Victor Valley Union High has 360 Black students and 99 white students -- large enough samples to resist random variation.
The geography is diverse. Vallejo and Pittsburg are in the East Bay. ABC Unified is in Southeast Los Angeles County. Stockton Unified↗ET is in the Central Valley. Natomas Unified↗ET is in Sacramento County. Victor Valley Union High is in the high desert of San Bernardino County.
The common thread is not geography but demographics. Many of these districts have majority-minority student populations where Black students are a substantial share of enrollment, not a small minority. In Vallejo, Black students make up roughly 20% of the cohort. In Pittsburg, about 26%.
What the Statewide Gap Hides
The statewide white-Black gap of 6.4 points has been shrinking rapidly -- from 15.6 points in 2018. But even that dramatic improvement understates what is happening at the local level, because the statewide gap is driven heavily by a few large districts and by County Offices of Education where all students struggle.
In the 47 reversal districts, the forces that typically suppress Black graduation rates -- poverty, housing instability, school discipline disparities, fewer AP course offerings -- have been overcome by something. The data cannot say what. It might be community investment, school leadership, targeted intervention programs, or the composition of the white student population in those districts.
The Vallejo Case
Vallejo City Unified is the most extreme reversal and worth examining. The district as a whole graduates at 79.5% -- well below the state average. Both Black and white students in Vallejo underperform their statewide subgroup averages. But Black students at 83.2% are 20 points closer to the state Black average (82.6%) than white students at 60.0% are to the state white average (89.0%).
Vallejo's white student population is small (50 in the cohort) and may include a disproportionate share of students with risk factors that depress graduation rates. The Black advantage in Vallejo may say as much about white student struggles as about Black student success. But the pattern -- Black students graduating at 83.2% in a high-poverty city -- is real.
Against the Grain
The existence of 47 reversal districts does not erase the statewide gap. It does, however, challenge the assumption that racial graduation gaps are immutable or universal. In nearly one in nine California districts with meaningful data for both groups, the expected hierarchy is reversed.
As the statewide gap continues to narrow -- 15.6 points in 2018, 6.4 in 2025 -- the number of reversal districts is likely to grow. The question is whether these reversals represent a leading edge of structural change or a collection of local anomalies that happen to cluster in the same direction.
The data suggests the former. Forty-seven is too many to be coincidence.
Detailed code that reproduces the analysis and figures in this article is available exclusively to EdTribune subscribers.
Discussion
Sign in to join the discussion.
Loading comments...