Correction: An earlier draft matched districts by name, which excluded districts whose names changed between reporting years, and it repeated transitional-kindergarten findings owned by a companion article. The revised story uses exact stable district IDs and keeps its interpretation within the enrollment records.
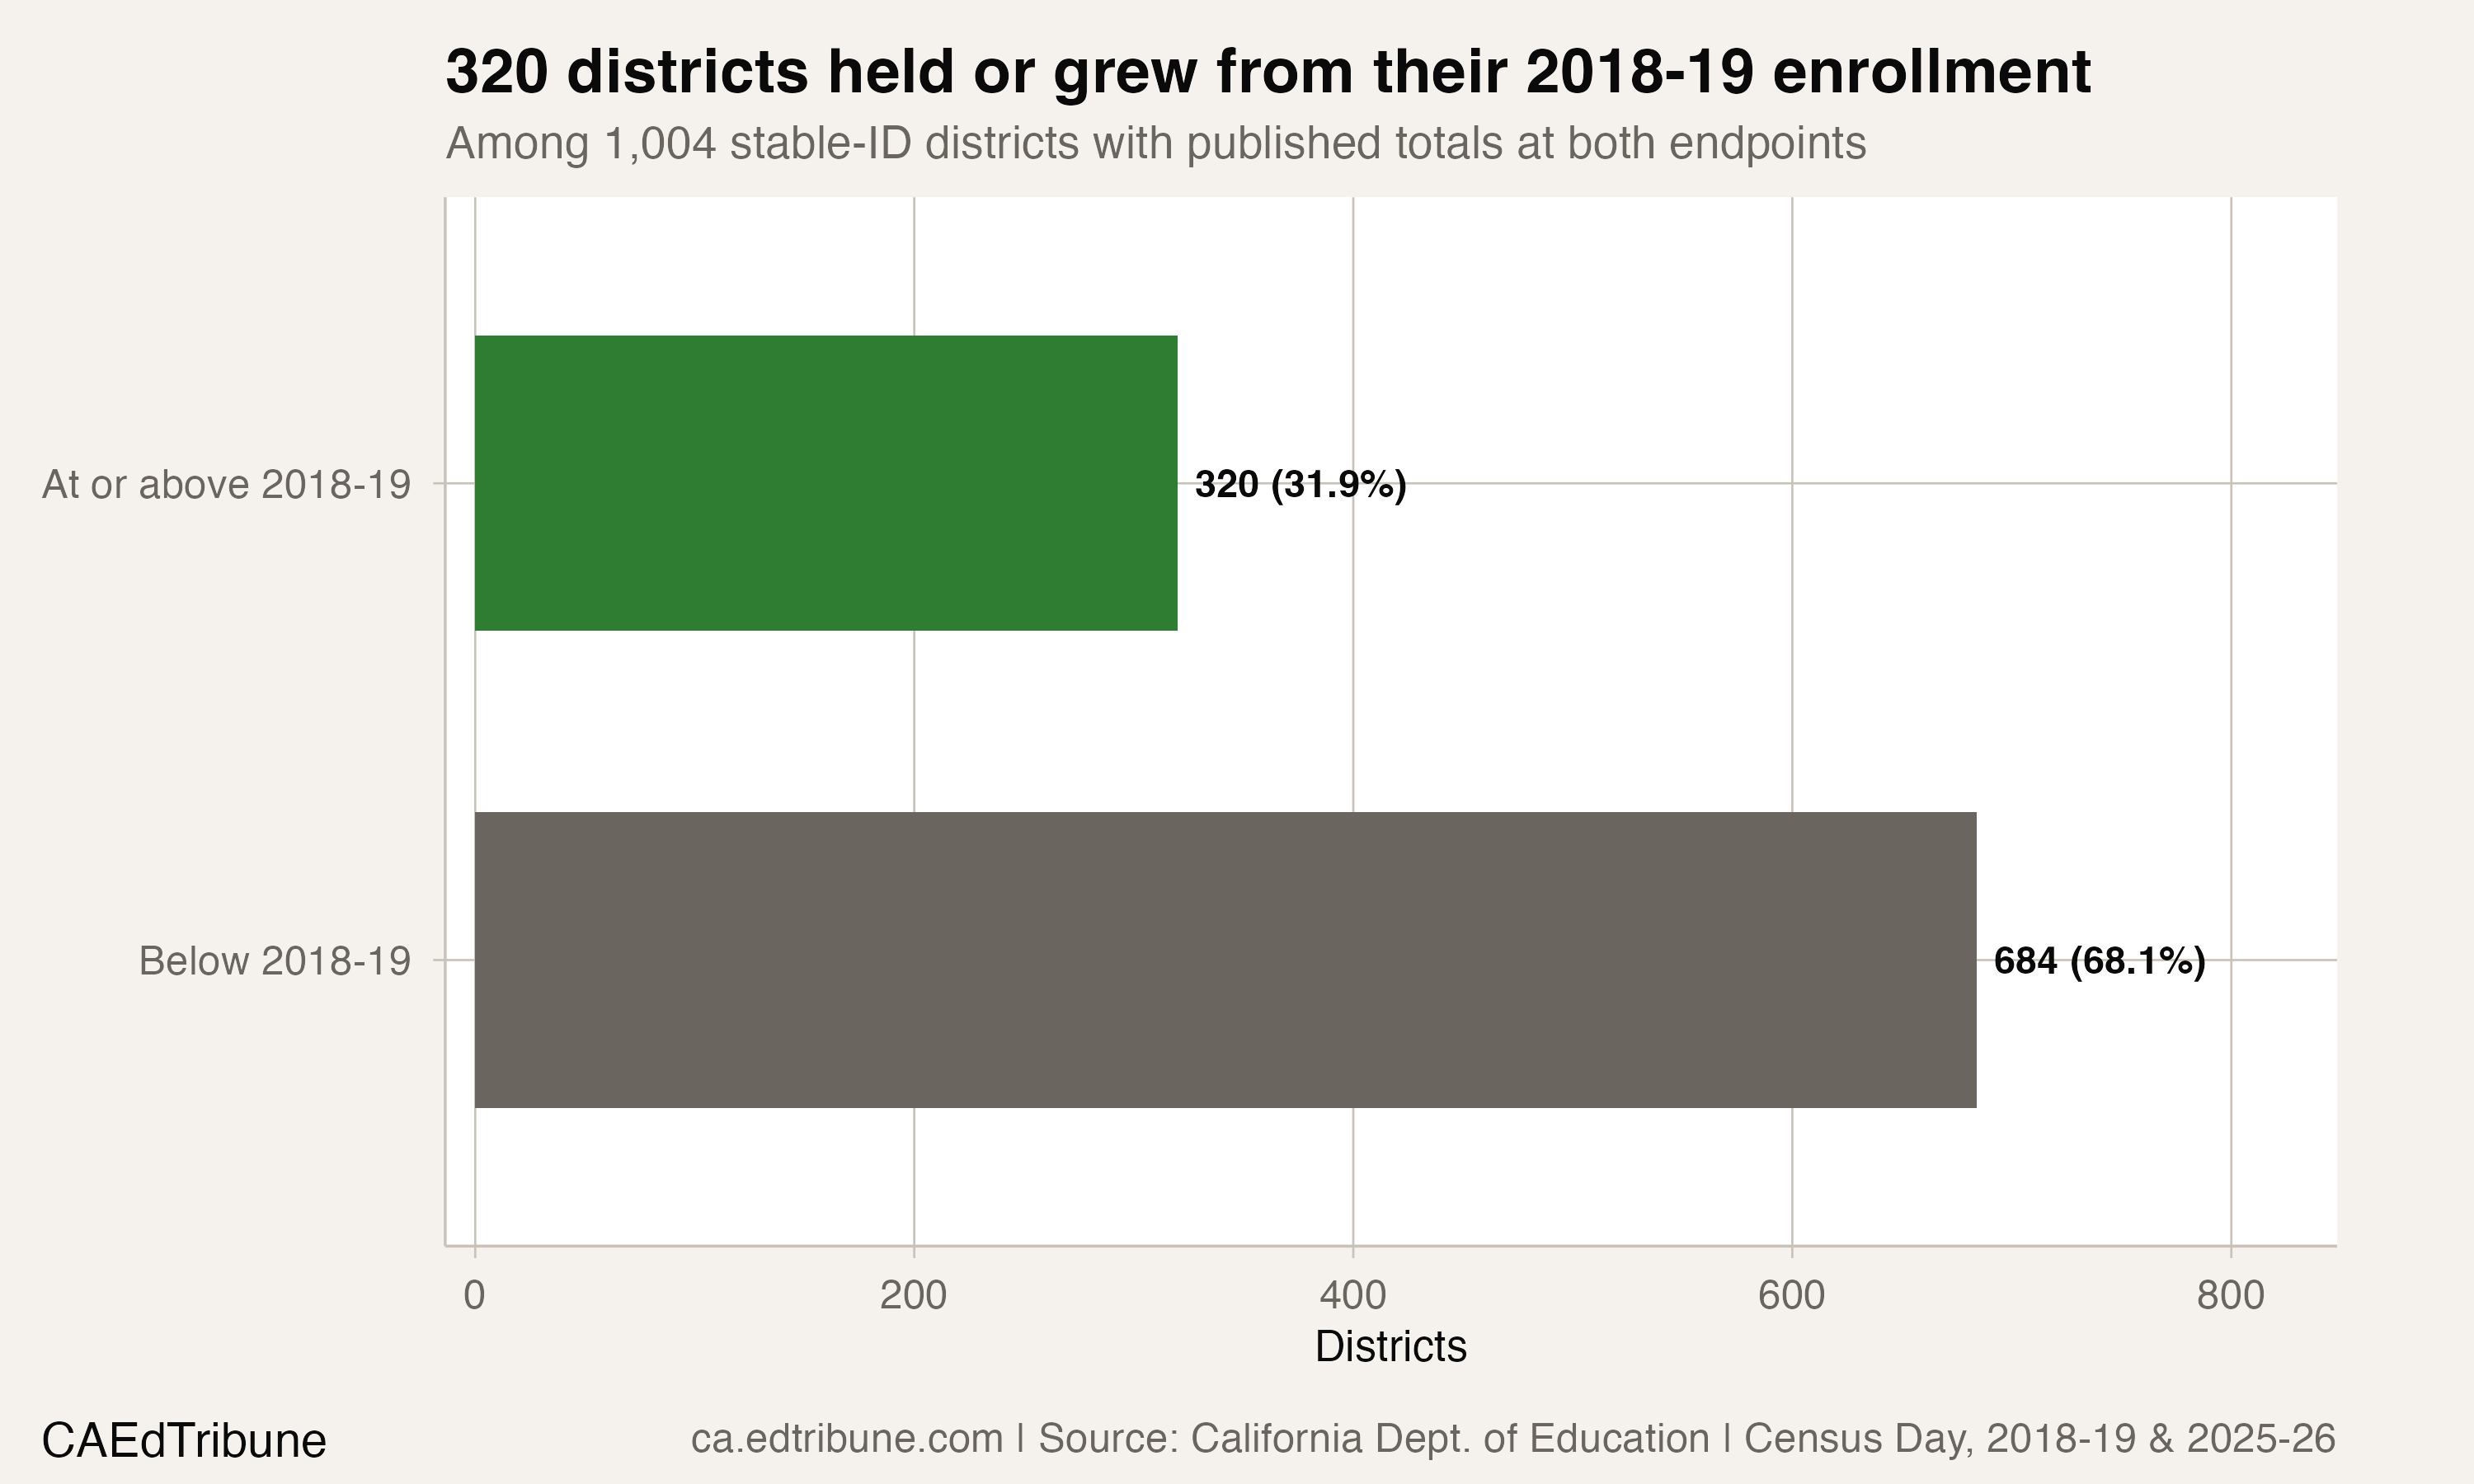
California's statewide enrollment loss accelerated in 2025-26, but the contraction was not universal. Among 1,004 districts with the same stable ID and a positive published total in both 2018-19 and 2025-26, 320 enrolled at least as many students at the endpoint. The other 684 enrolled fewer.
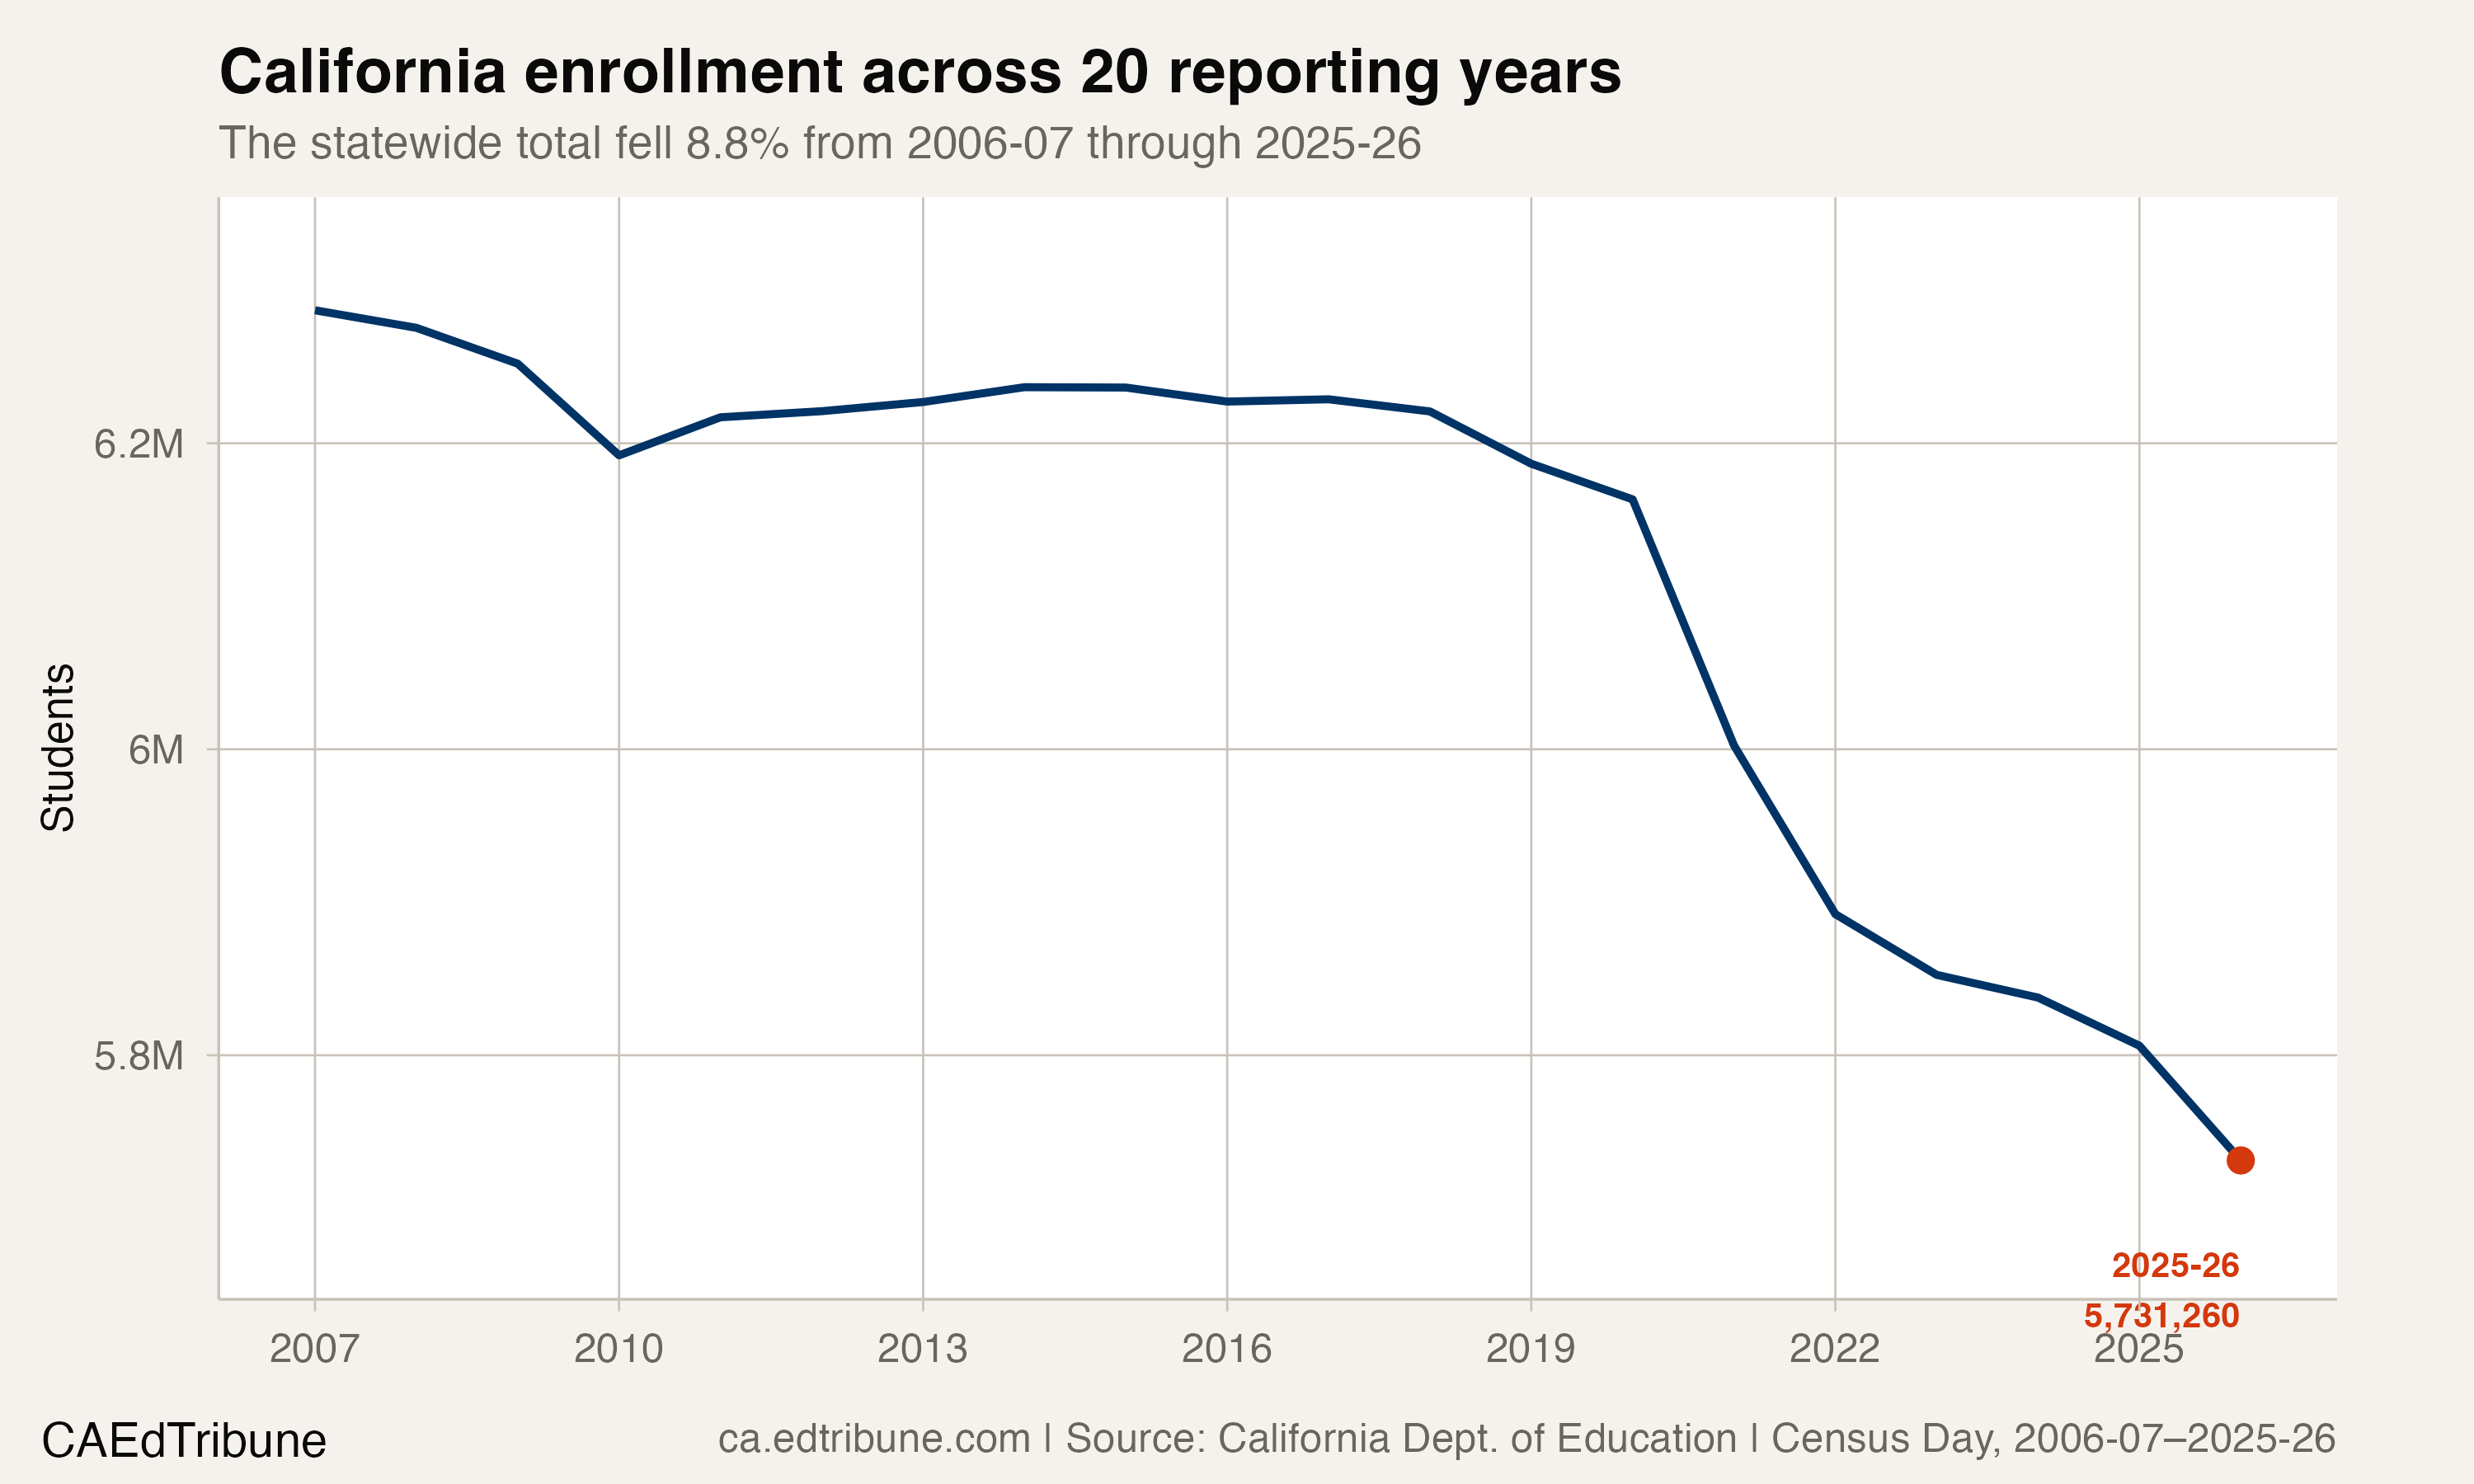
At the state level, California public schools enrolled 5,731,260 students in 2025-26, down 74,961 from the year before.
The statewide loss accelerated
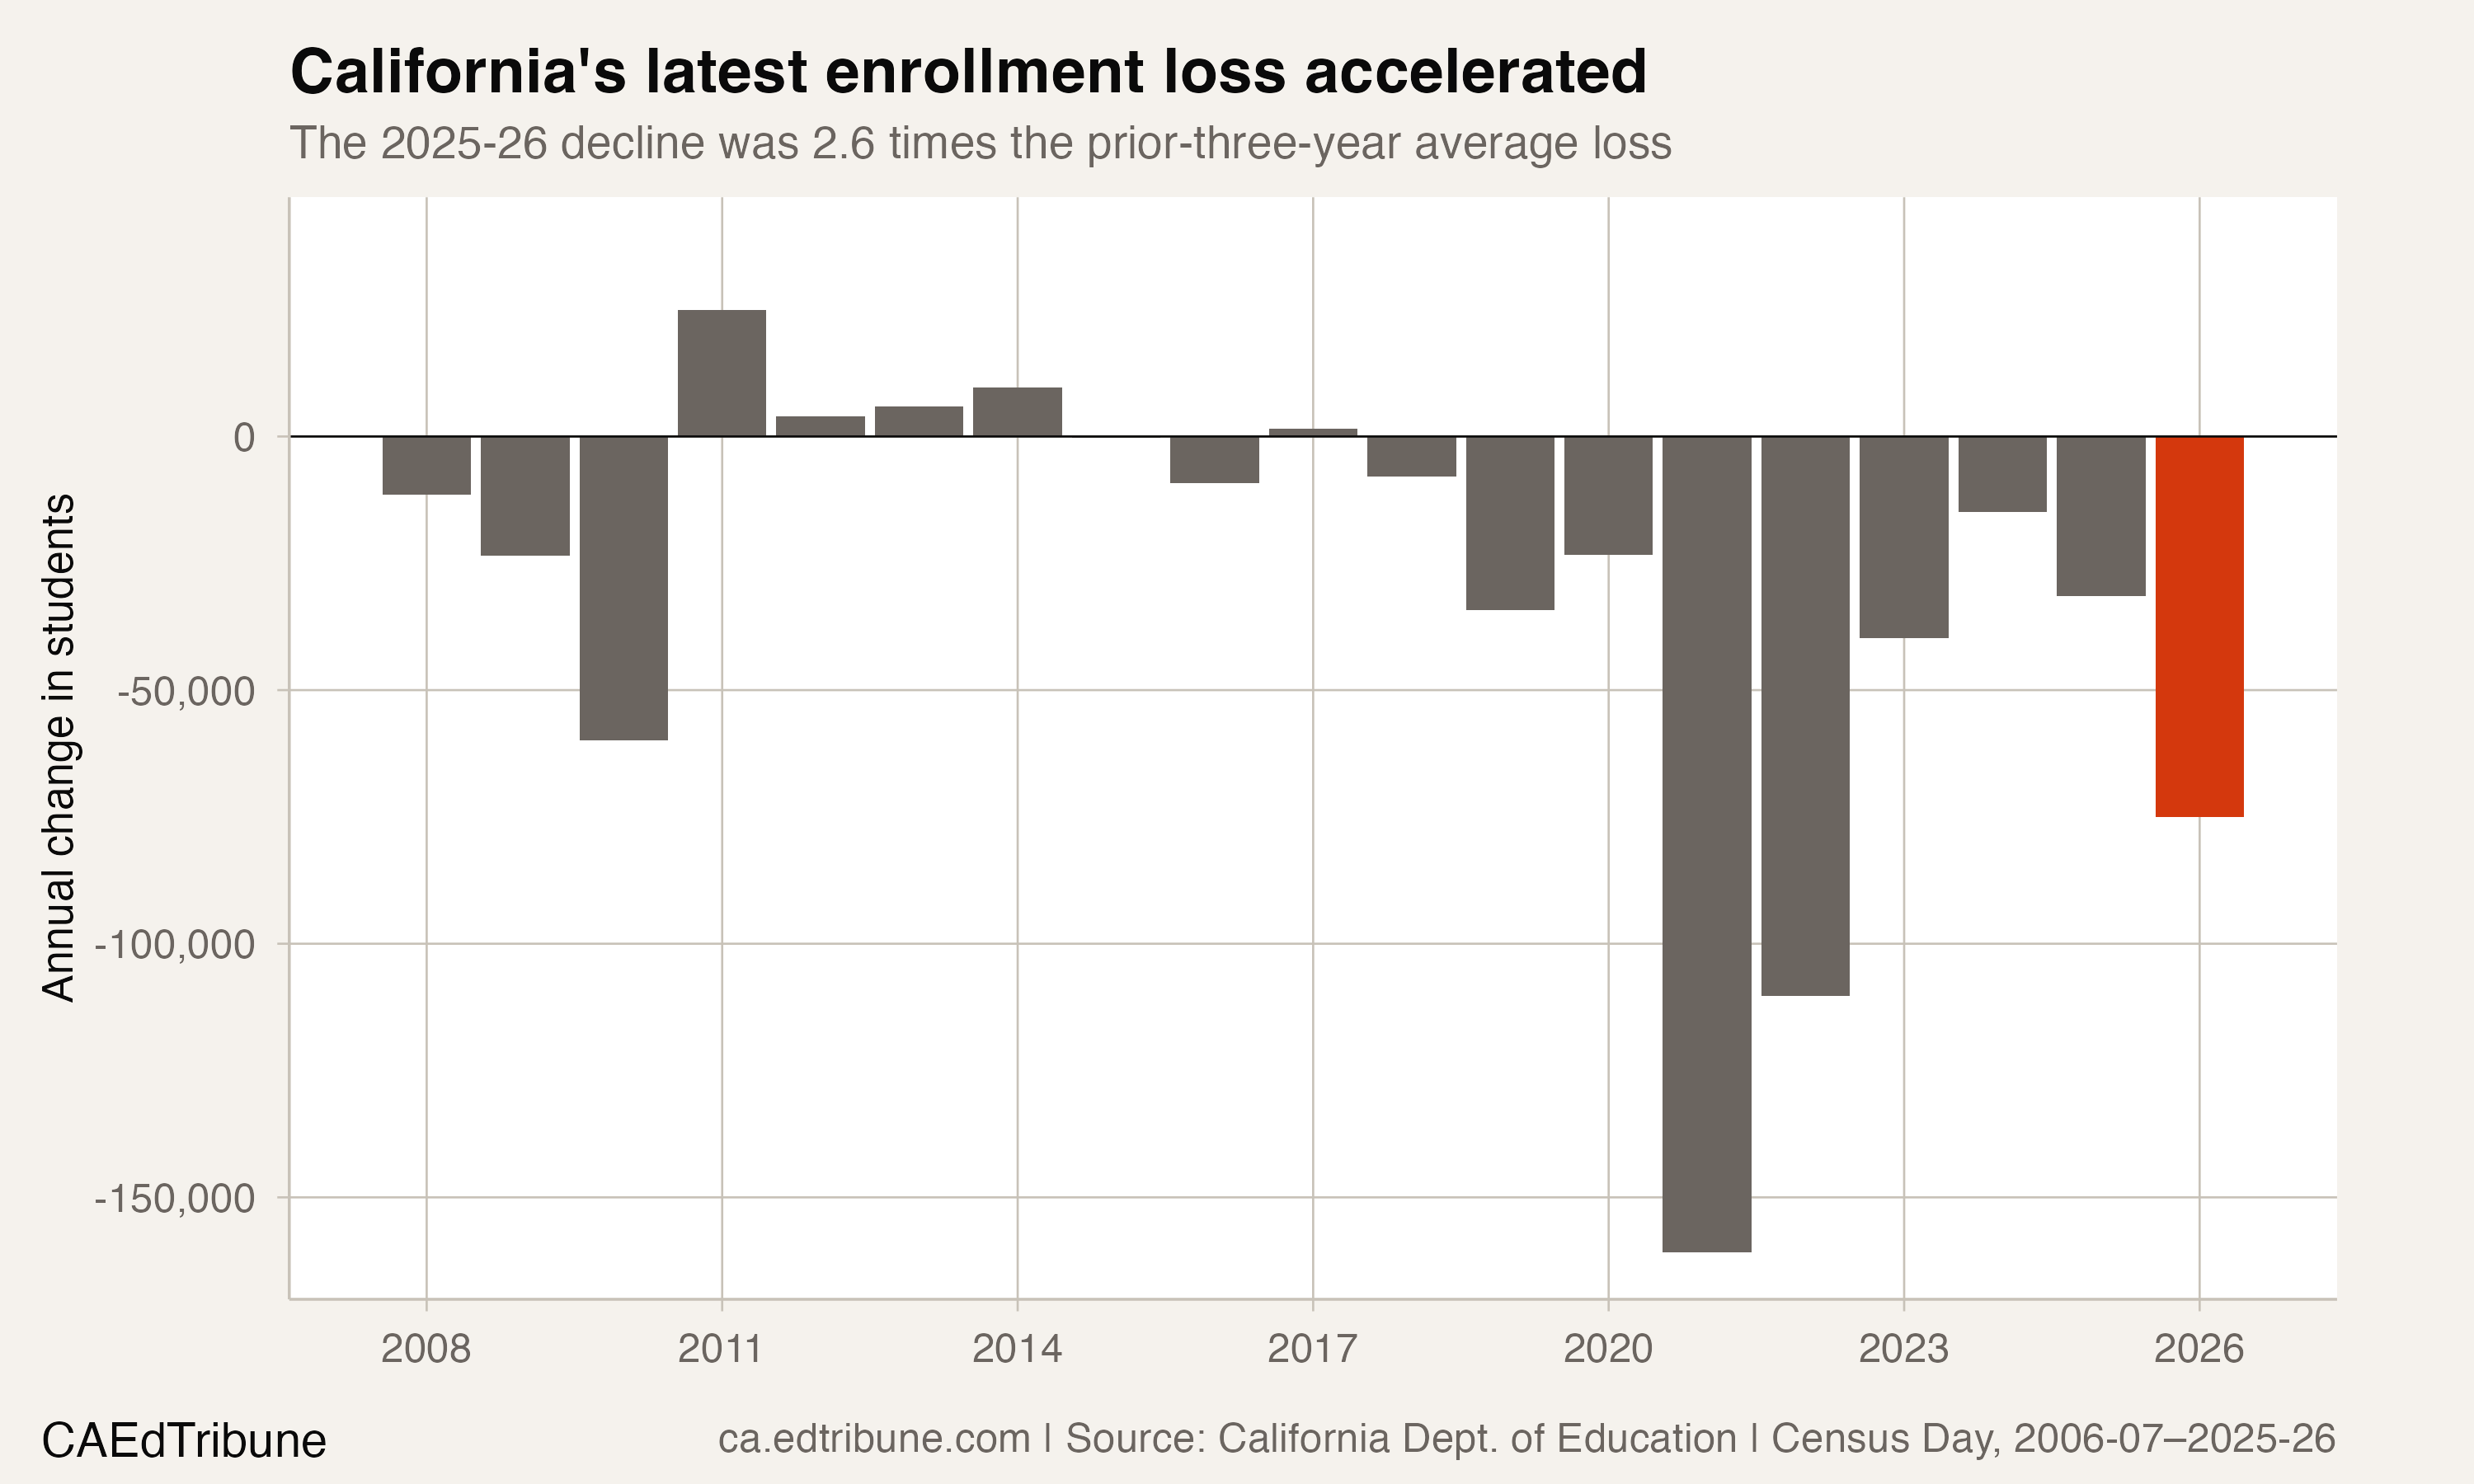
California had posted three smaller annual losses before the latest drop: 39,696 students in 2022-23, 14,854 in 2023-24 and 31,469 in 2024-25. The 2025-26 loss was 2.6 times the average of those three declines.
That comparison describes a change in pace, not a cause. The state count moved farther downward in the latest annual transition after three smaller losses.
The third-largest decline in the available panel
The complete state series covers 20 reporting years, from 2006-07 through 2025-26. Across its 19 annual transitions, the 2025-26 loss ranks third. The two larger declines ended in 2020-21 and 2021-22, making the latest drop the largest since 2021-22.
The long view also shows that California's path was not uniformly downward. Enrollment declined in 14 of the 19 annual transitions. Across the full panel, the statewide total fell from 6,286,943 to 5,731,260, a net loss of 555,683 students, or 8.8 percent.
A stable-ID district comparison
The district count uses the intersection of exact state-issued district IDs with positive published totals at both endpoints. It does not match on names. That distinction matters because a renamed district can remain the same reporting entity even when its display name changes.
Moving the baseline one year earlier produces a similar result: 298 of 994 stable-ID districts enrolled at least as many students in 2025-26 as in 2017-18. The statewide decline therefore coexisted with a substantial group of local systems that held or grew, but that group remained a minority under either baseline.
What the file can and cannot establish
The direct evidence is the enrollment count and its distribution across reporting entities. Birth cohorts, migration, housing, school choice, school openings or closures, and local policy remain competing explanations; California's annual Census Day enrollment files do not assign the observed change among those mechanisms.
For district leaders, the distinction between the statewide path and the local distribution is the useful finding. A sharper statewide loss does not mean every district followed the same route. It shows a smaller group of stable or growing districts beside a larger group that enrolled fewer students.
Enrollment figures come from the California Department of Education's Census Day Enrollment files. The analysis uses state-level all-schools totals for 2006-07 through 2025-26 and exact stable district IDs for the endpoint comparisons.
Detailed code that reproduces the analysis and figures in this article is available exclusively to EdTribune subscribers.
Discussion
Sign in to join the discussion.
Loading comments...