Correction: An earlier draft included a hypothetical charter share built from enrollment figures from different years. That comparison has been removed; every share in this article now uses California's published statewide total for the same year.
California's newest enrollment data show charter schools enrolling the highest share in the state's three-year charter-status split. In 2025-26, charters accounted for 12.66 percent of all public school enrollment, up from 12.16 percent two years earlier. That is the high point for the three years in which the California Department of Education's Census Day Enrollment file reports charter and non-charter enrollment.
The number is real. The easy reading is not. A rising market share can sound like a sector on the march. That is not what the 2023-24 through 2025-26 split shows. California's charter enrollment rose modestly while the much larger district-operated sector shrank, and shrank fast.
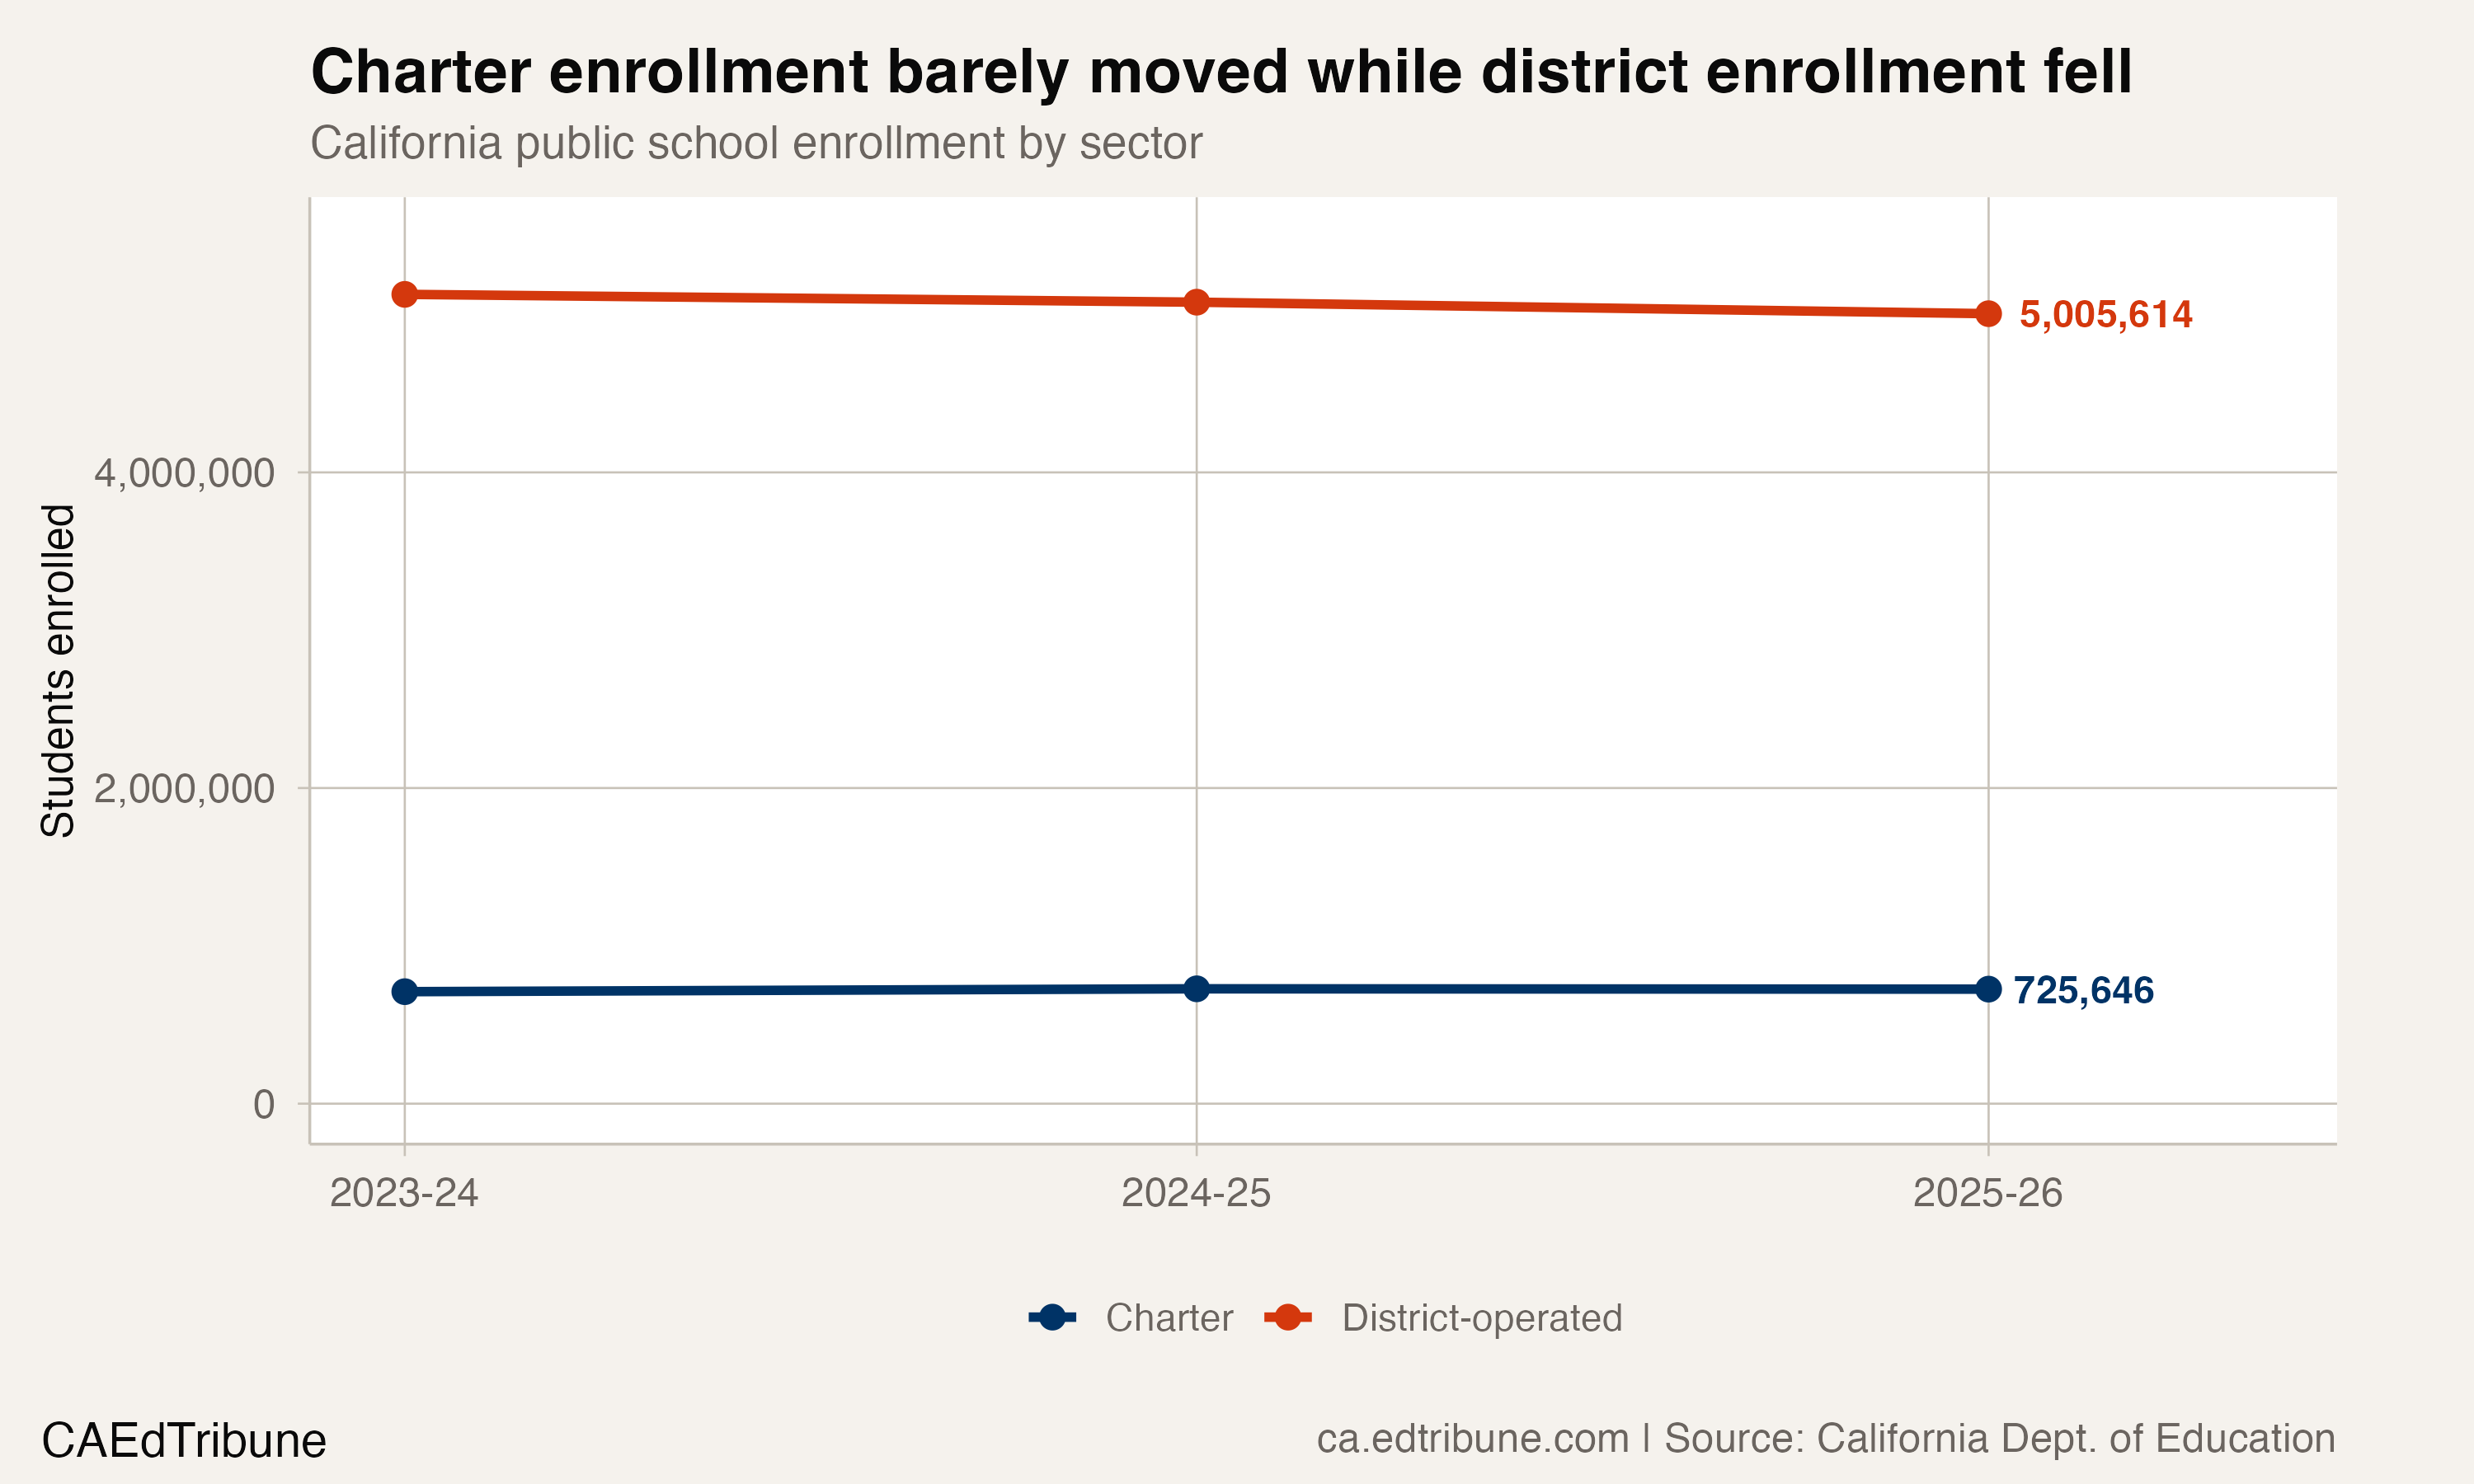
What the two lines actually did
Start with the charter sector. In 2023-24, California charter schools enrolled 709,635 students. By 2025-26, that figure was 725,646. That is a gain of about 16,000 students over two years, or 2.3 percent, the kind of slow drift that looks nearly flat on a chart of the full system.
Now the district-operated sector, meaning the traditional public schools that districts run directly. In 2023-24 those schools enrolled 5,128,055 students. Two years later the count was 5,005,614, a loss of about 122,000 students, or 2.4 percent. The district sector lost almost eight students for every one the charter sector added.
When the smaller number rises and the much larger number falls, both changes push the smaller number's share of the whole higher. That is the arithmetic behind the share high. Charter enrollment is being divided into a shrinking statewide total of 5,731,260, down 74,961 students from 2024-25 to 2025-26. Across the full state-total history checked here, that was California's largest one-year decline since 2021-22.
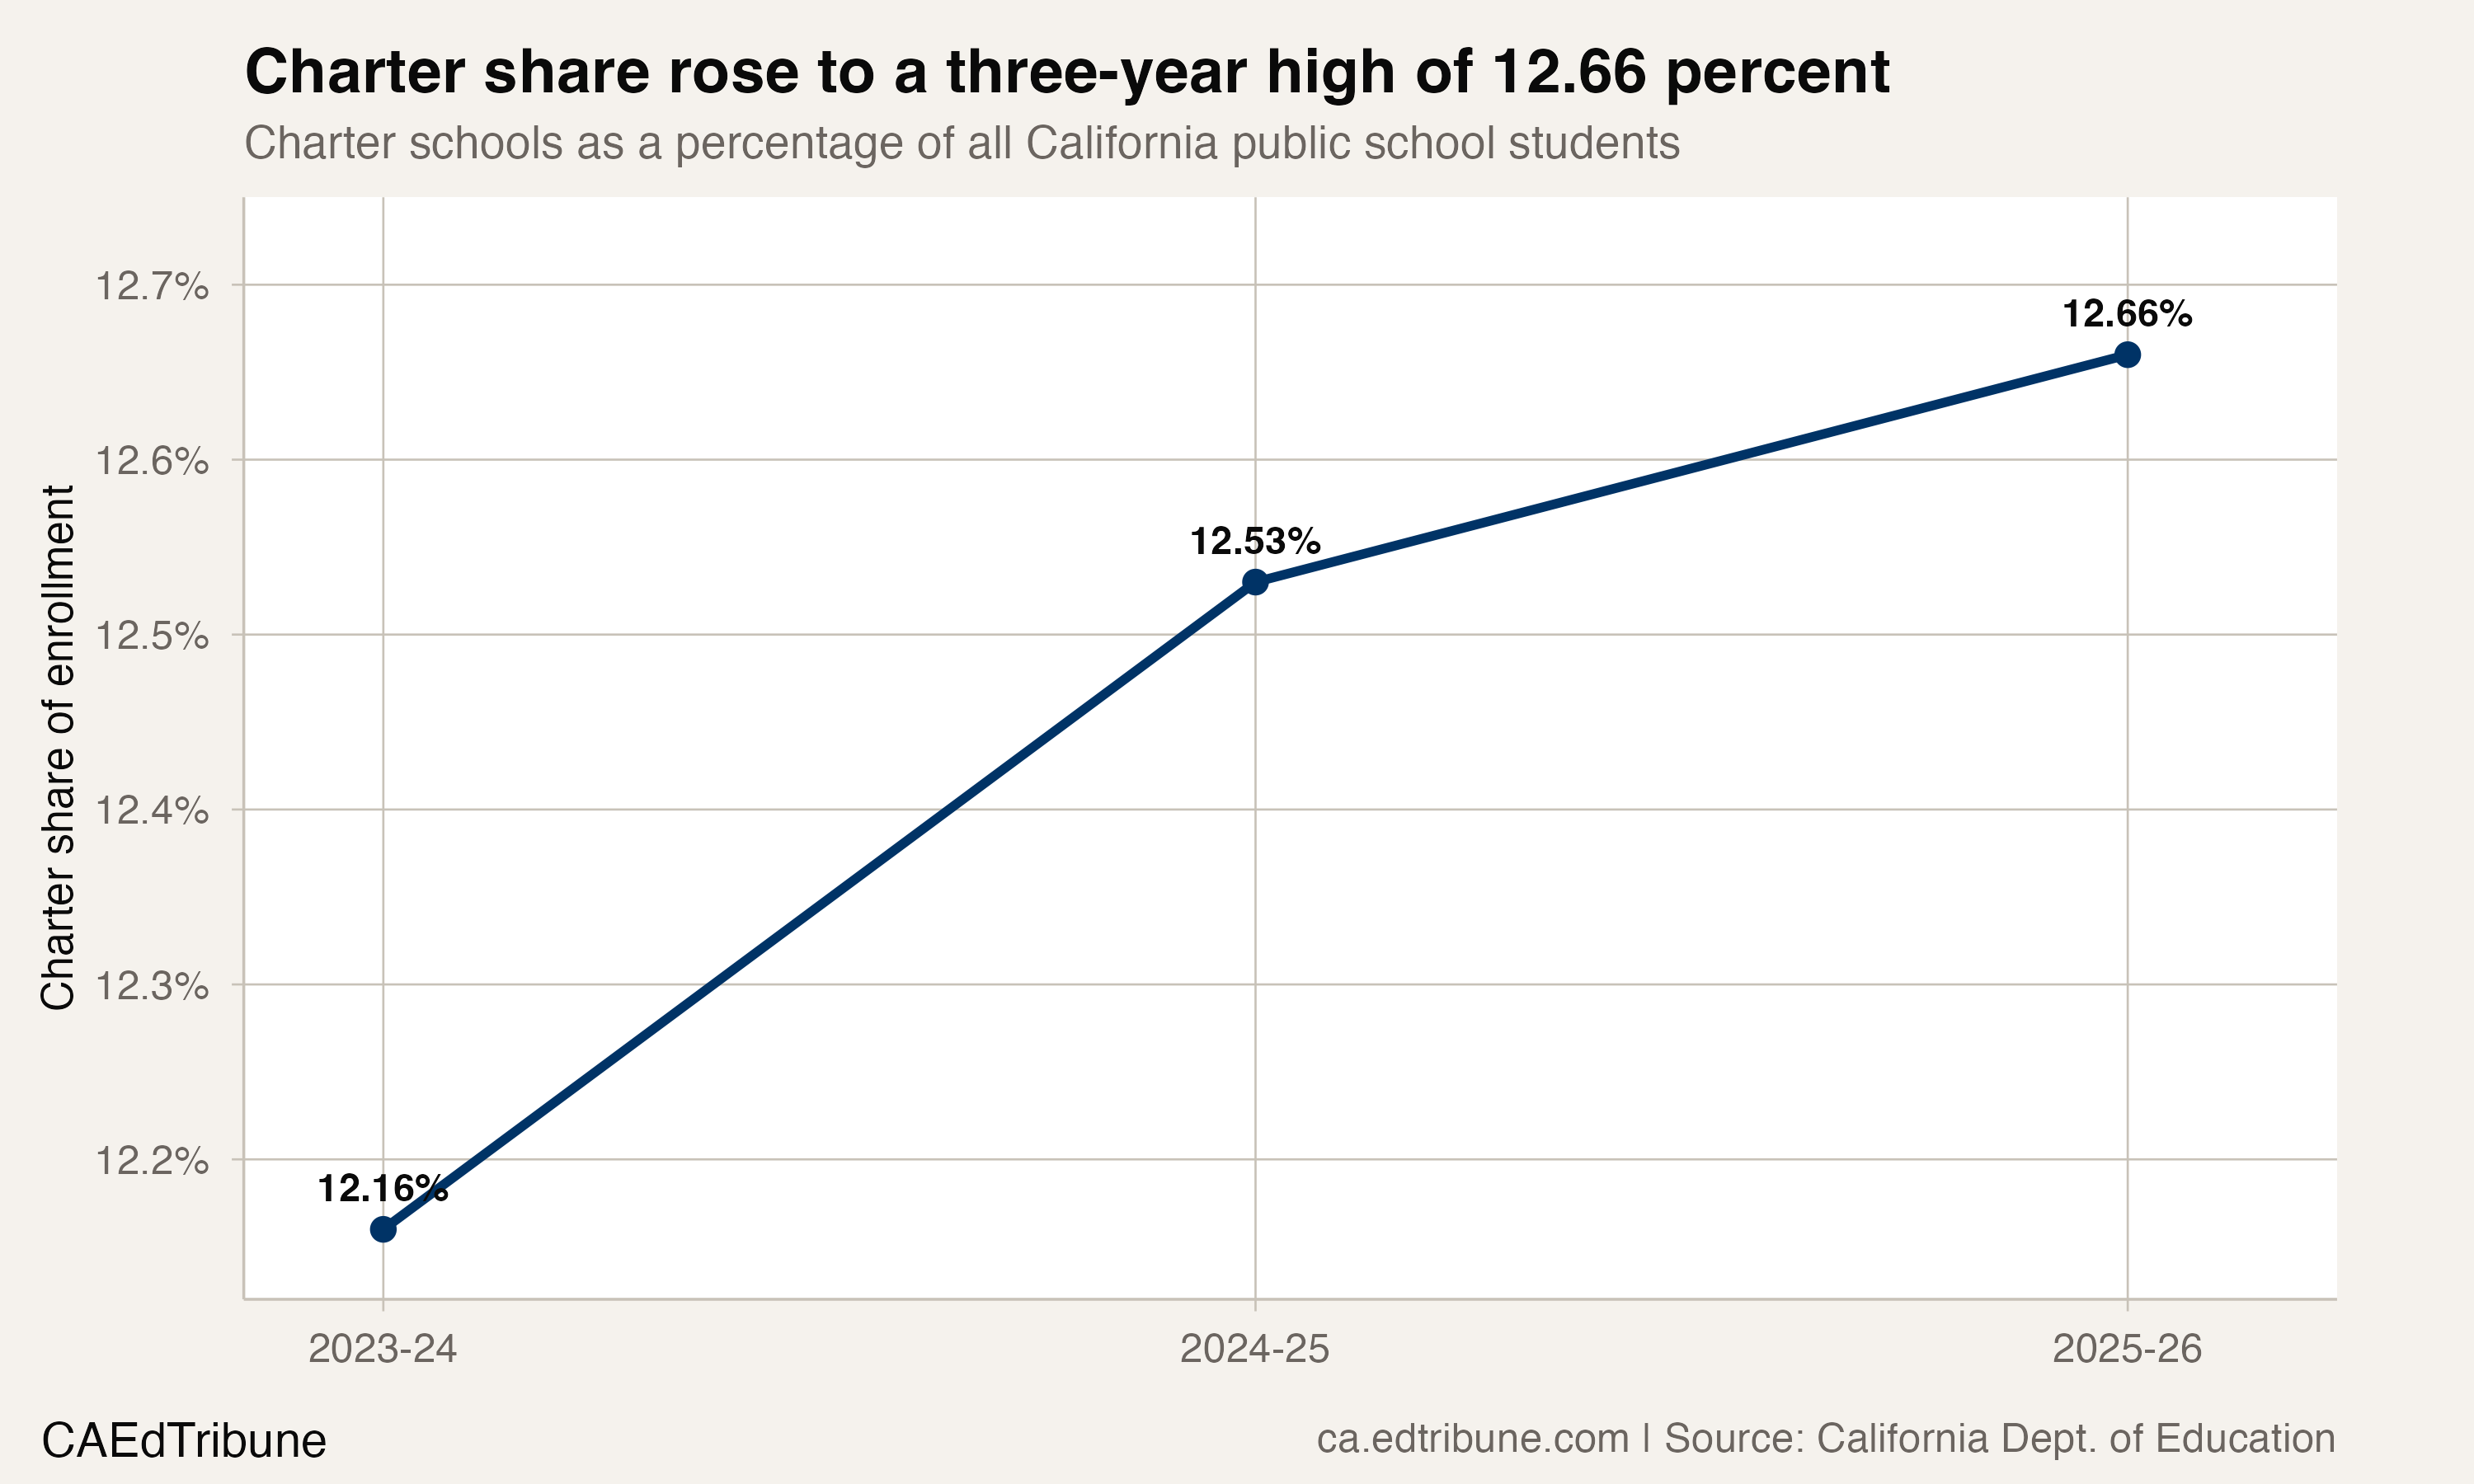
The sectors moved in opposite directions
Put the net changes side by side and the picture is hard to misread. District-operated schools lost about 122,000 students. Charter schools gained about 16,000. Both movements raised the charter share, but the underlying enrollment changes were lopsided.
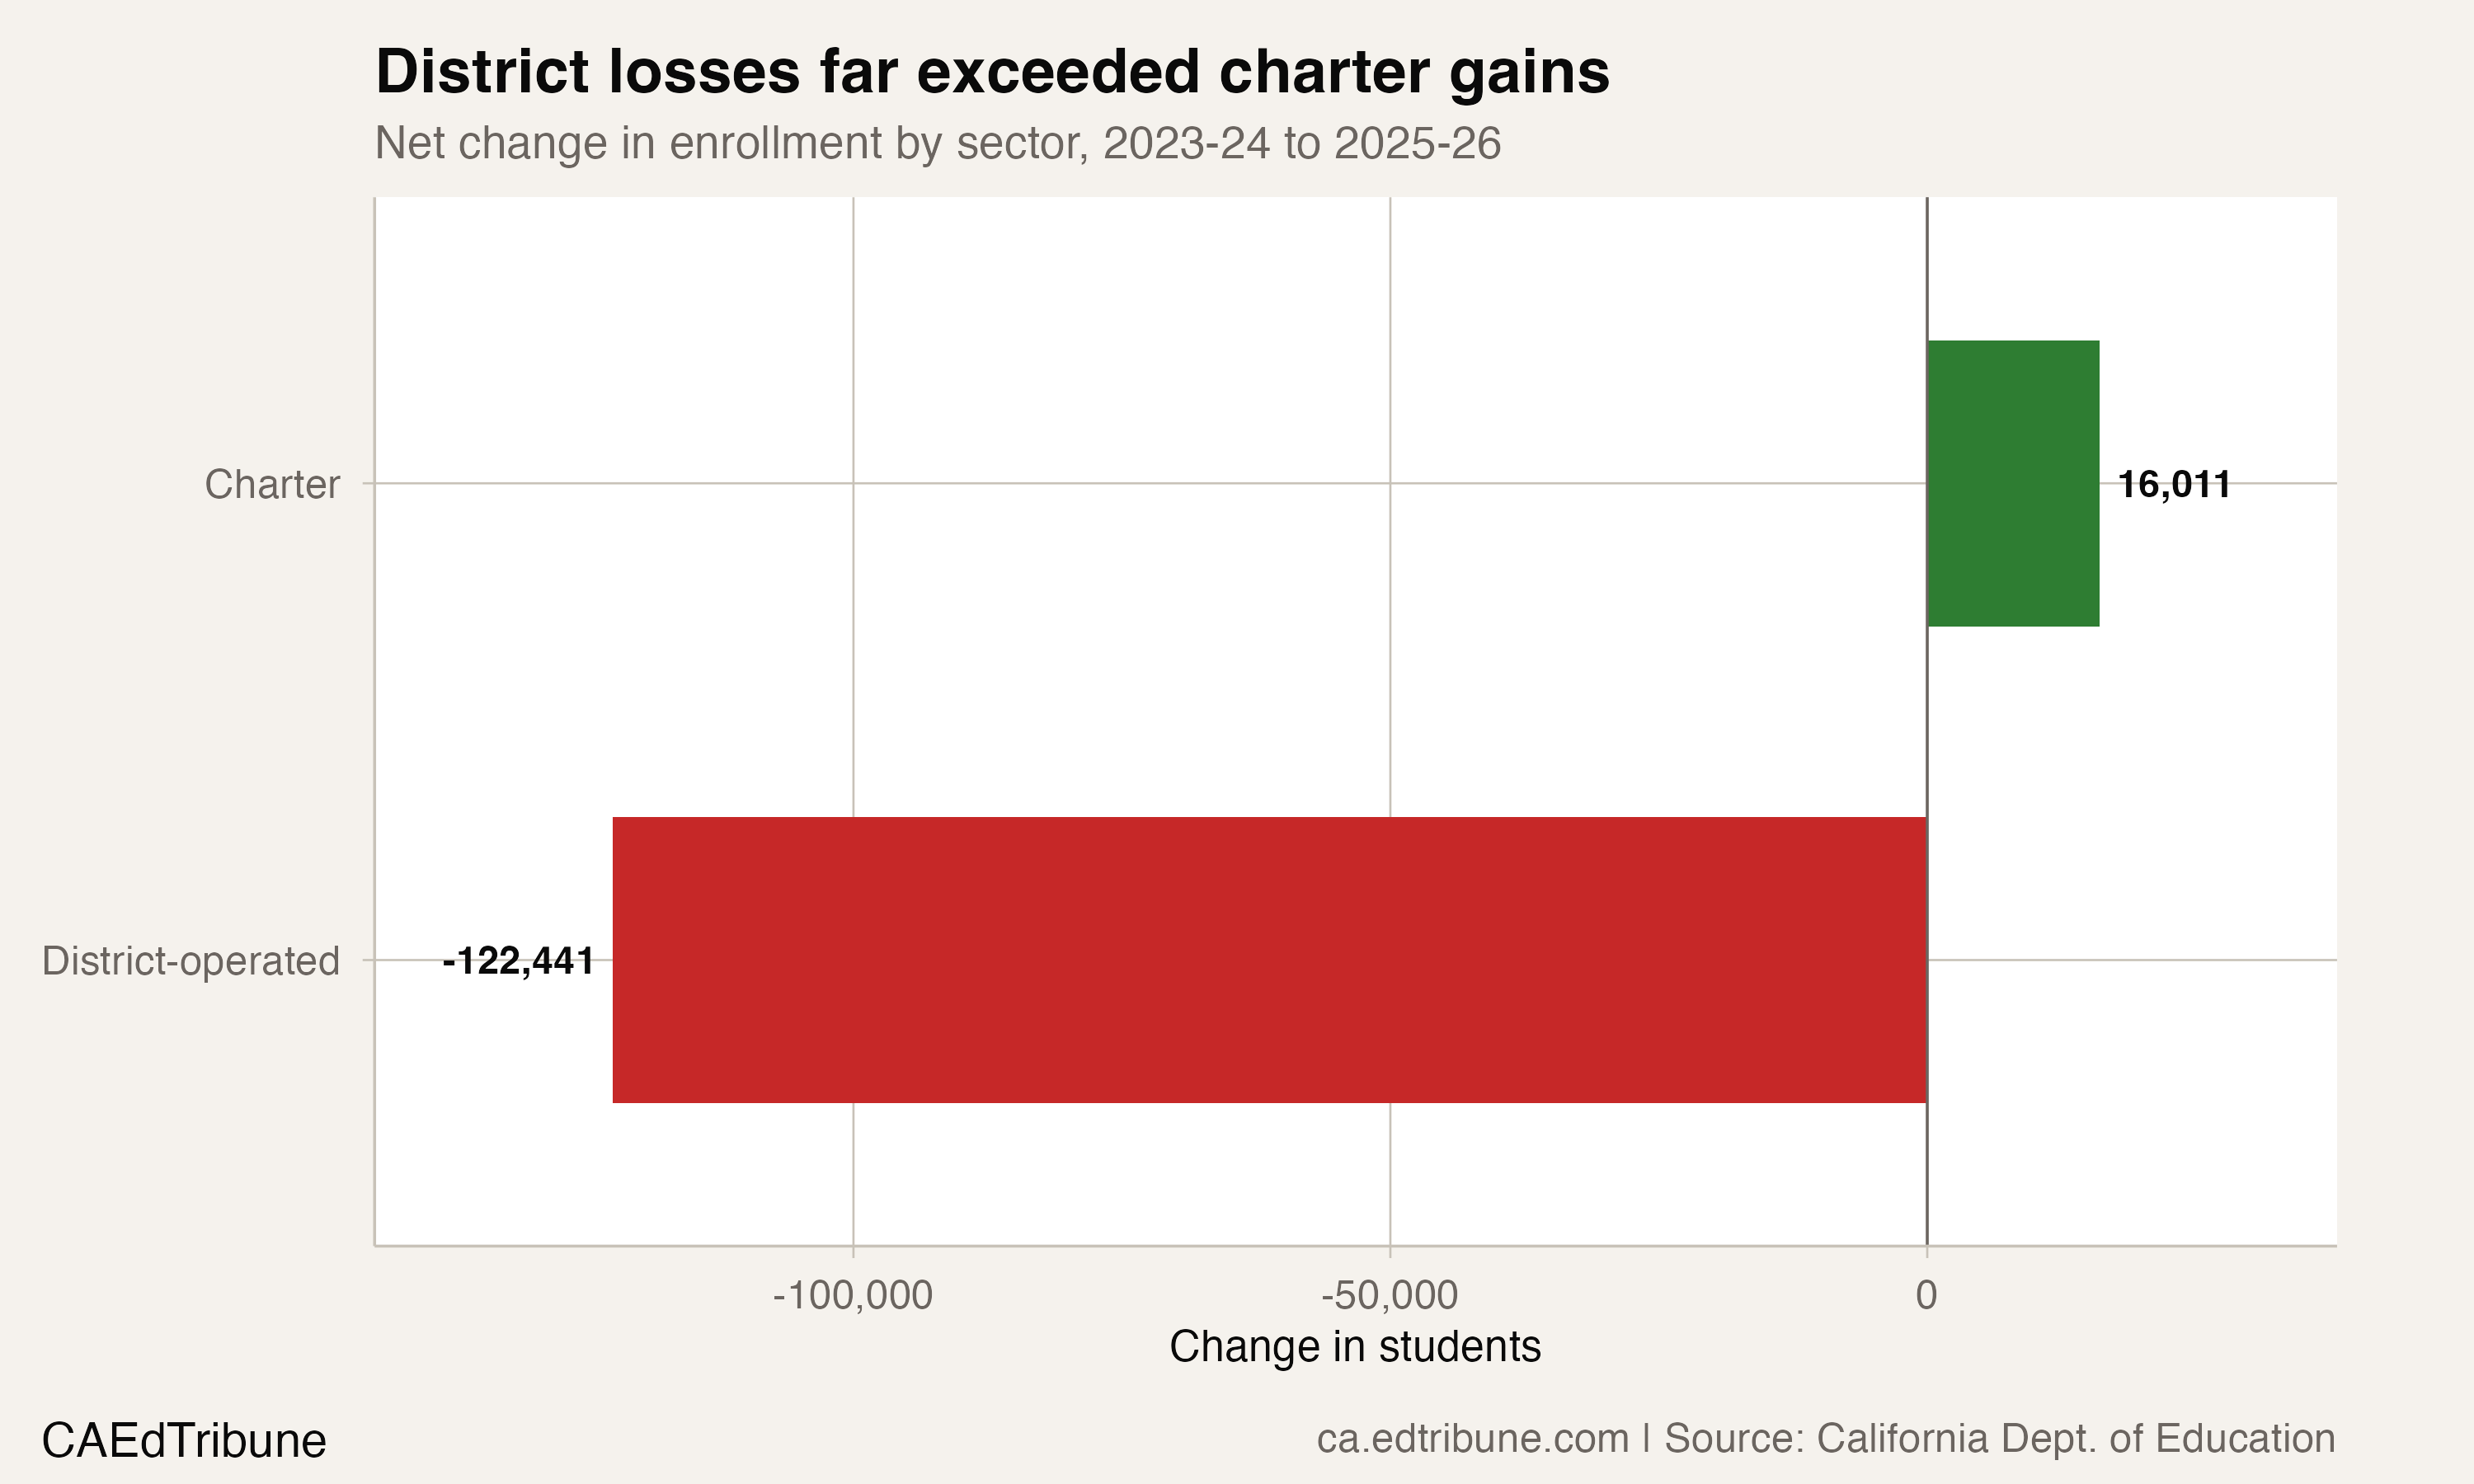
This matters because share statistics get used as evidence. Read alone, a rising charter share can suggest that charters are winning families or draining traditional schools. The direct evidence in the California data is narrower: over these two years, charter enrollment rose modestly while district-run enrollment fell much more.
A note on how the count is built
California's DataQuest release describes Census Day enrollment as a single-day snapshot and says the updated file includes state, county, district and school levels, along with charter and non-charter views. This article uses only the state-level charter-status split: charter schools in one statewide figure, district-operated schools in another, and the two add up exactly to the state total of 5,731,260. For sector-share questions at the state level, that is the clean comparison.
There is a real limit to how far back this comparison can go. California's files carry statewide totals before 2023-24, but not usable charter and non-charter state rows. The numbers in this piece cover the three years for which that split exists, 2023-24 through 2025-26, and the article makes no claim about charter share before that.
The aggregate file also cannot identify why enrollment moved in either sector. School openings and closures, migration, demographic change and family choices remain competing explanations that this state-level split cannot separate.
The takeaway
California's charter sector hit the high point in the state's three-year charter-status split in 2025-26, and that is worth noting. The enrollment changes underneath it were uneven. The charter line is close to flat. The district line is falling. Both changes pushed the charter share higher, but the district loss was far larger in student counts than the charter gain.
For anyone trying to read California's enrollment future, the more important signal is not the charter share at all. It is the total, down 74,961 students in a single year. Charters and districts are both inside that statewide decline. One is simply holding its footing a little better than the other.
Enrollment figures come from the California Department of Education's Census Day Enrollment file. The analysis uses state-level charter-status rows covering 2023-24 through 2025-26; charter and district-operated counts reconcile to the published all-schools total before any share is computed.
Detailed code that reproduces the analysis and figures in this article is available exclusively to EdTribune subscribers.
Discussion
Sign in to join the discussion.
Loading comments...